

- Ethereum price confirms triple bottom at $3,600, signaling strong support.
- Analysts track breakout potential above $4,000 resistance trendline zone.
- Wyckoff re-accumulation model supports ongoing consolidation before reversal.
- Network fees drop 48%, reflecting lower congestion and steady accumulation.
Ethereum price has steadied this week as an analyst pointed to a confirmed triple-bottom formation on the four-hour chart. This suggests a potential reversal in momentum after several weeks of consolidation.The pattern, forming between October 12 and October 23, emerged alongside a descending trendline. The trendline has consistently capped attempts to break higher near the $4,000 region.
Analyst Identifies Triple Bottom at $3,600
ETH just confirmed Triple Bottom at the $3,600 level. From the analyst’s chart, we can see three distinct reactions to the same demand level. The first trough occurred on October 12 after a sharp intraday drop. This was followed by a second dip on October 17 that quickly recovered from similar levels. The third test took place around October 22–23, completing the pattern and marking the strongest reaction of the three.
Each rebound from the $3,600 level was met with selling pressure along a descending dotted trendline drawn from early October highs. Ethereum was last seen trading around $3,892, with the descending resistance cutting across the $3,950–$4,050 range. Above that, a broader resistance zone remains visible between $4,750 and $4,850. This is an area that previously triggered selloffs earlier in the month.
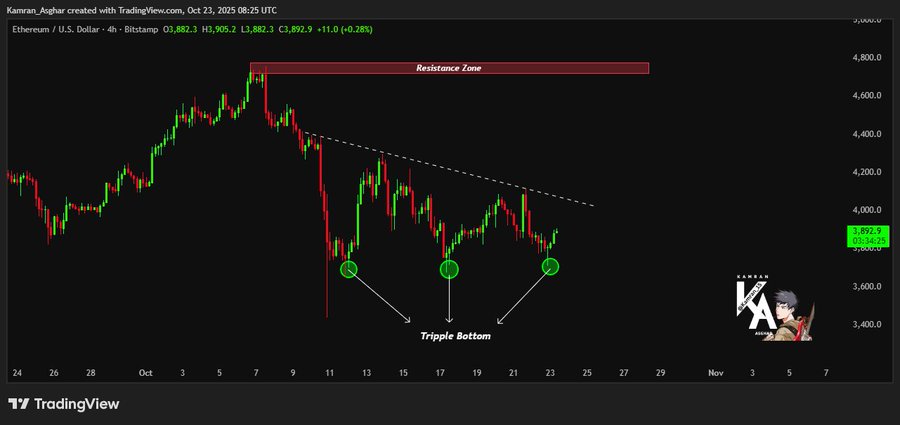
4-hour ETH/USD Chart | Source: X
The triple-bottom formation identified by the analyst highlights consistent buying interest at the $3,600 support. In technical terms, three successful defenses of the same level strengthen the probability of a structural floor.

A close below this threshold would invalidate the setup, while a sustained breakout above $4,000 could confirm the reversal. This would open the door toward $4,300 and beyond. Data from the past two weeks shows each dip producing smaller wicks on the downside. This reflects reduced selling strength and steady accumulation pressure.
Re-Accumulation Phase Aligns With Wyckoff Schematic
Another market observer supported the same conclusion through a Wyckoff re-accumulation model. According to the analyst, $ETH Wyckoff re-accumulation is happening right now. This suggests that current consolidation fits within the broader uptrend that began earlier in the year.
The accompanying three-day ETH/USDT chart displays key Wyckoff phases, Buying Climax (BC), Secondary Test (ST), Automatic Rally (AR), and Last Point of Support (LPS). In this schematic, the $4,050 area acts as the midpoint between re-accumulation and breakout territory. The pattern suggests Ethereum is currently forming its LPS phase, attempting to hold above $3,600 and preparing for a move through $4,050.
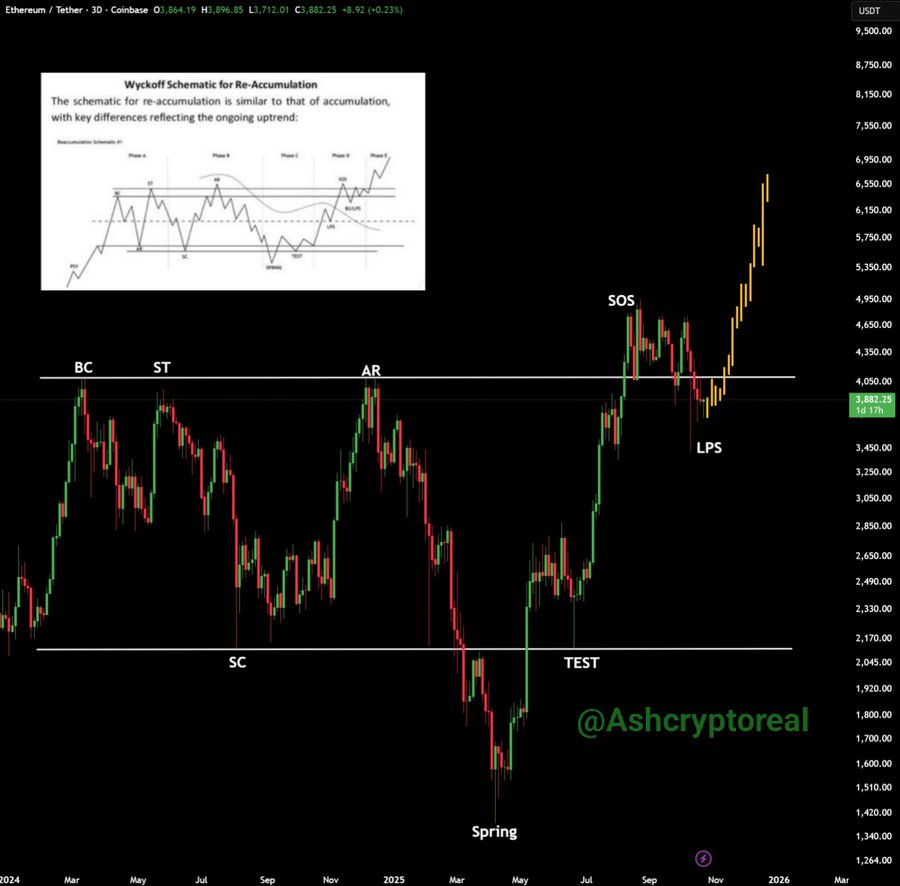
While the analyst mentioned long-term projections of $8,000 to $10,000, the immediate data-driven takeaway focuses on ETH’s ability to maintain support and stabilize after the October decline. This technical alignment between the four-hour and three-day charts reinforces the same message. Ethereum’s $3,600 level remains a structural pivot for price recovery attempts.
On-Chain Data Reflects Cooling Activity
Blockchain data from Artemis adds further context to Ethereum’s market behavior. Network fees, a measure of transactional demand, have declined to $742,300, marking a 48.2% decrease compared to the previous reading. The last three months featured two notable fee spikes. In late August and early October, where totals briefly surged above $10 million before retracing.
ETH Fees Data | Source: Artemis
This contraction in fees signals reduced short-term pressure on the network. Lower costs generally correspond with quieter trading conditions and diminished transaction congestion, both consistent with Ethereum’s recent stabilization around the $3,600 zone. The moderation in fee data provides quantitative backing for the notion of a cooling market environment that allows accumulation phases to develop.
Get 3 Free Stock Ebooks
Discover top-performing stocks in AI, Crypto, and Technology with expert analysis.
- Top 10 AI Stocks - Leading AI companies
- Top 10 Crypto Stocks - Blockchain leaders
- Top 10 Tech Stocks - Tech giants


