

TLDR
- Ethereum breaks above a decade-long resistance trendline, signalling the end of a multi-year consolidation phase.
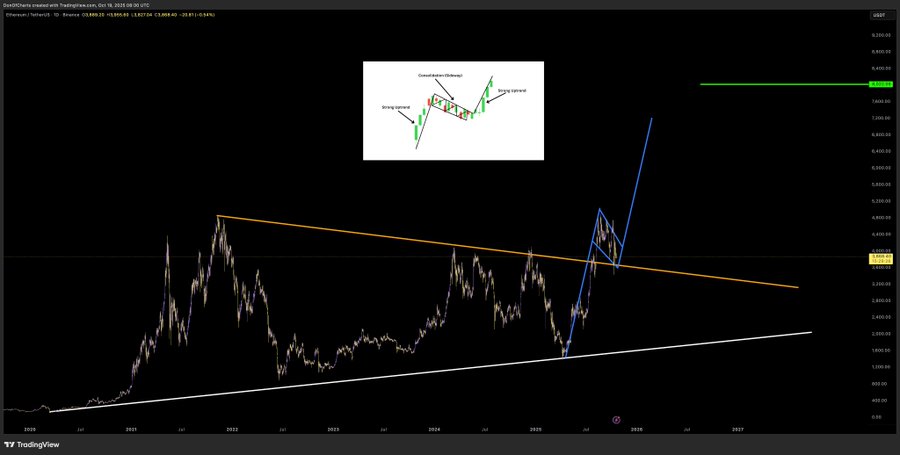
- ETH forms a bullish flag pattern, indicating potential continuation toward the $10K–$12K target range.
- The ETH/BTC ratio rebounds from oversold zones, hinting at a possible macro rotation favouring Ethereum.
- Historical resistance turns into support, reinforcing Ethereum’s bullish momentum for the upcoming market cycle.
Ethereum is showing strong signs of a long-term bullish breakout after years of consolidation. The latest chart patterns indicate that ETH may be preparing for a decisive upward move toward the $10,000–$12,000 range. Analysts believe that the asset’s technical structure is shifting, marking the potential start of a new macro uptrend after a prolonged period of accumulation. With both ETH/USD and ETH/BTC pairs flashing reversal signals, Ethereum could be on the verge of outperforming Bitcoin in the upcoming market phase.
Ethereum Breaks Above Multi-Year Resistance
The Ethereum price has finally broken above a major descending resistance trendline that dates back to its 2021 cycle highs. The orange line, visible across several chart analyses, had capped upward movements for almost three years. This breakout, therefore, represents a crucial structural change that could signal the end of Ethereum’s long consolidation period.
ETH/USD 1M Chart | Source: X
The chart also shows a smaller bullish flag pattern in blue, typically recognised as a continuation formation. This pattern emerged after a steep upward leg, implying the potential for another strong rally once the flag’s resistance is cleared. The inset chart reinforces this thesis, showing how similar setups in past cycles have led to sharp price expansions.
Long-Term Support Reinforces Ethereum’s Bullish Setup
Moreover, the white ascending trendline that extends from Ethereum’s early trading years acts as a solid foundation for the ongoing uptrend. This structure has served as dynamic support throughout multiple market cycles, reflecting consistent accumulation by long-term investors. Historically, each touch of this trendline has preceded multi-month rallies, which strengthens its relevance in the current setup.
In addition, Ethereum’s market behavior continues to show rising demand near key technical zones. This accumulation pattern suggests that investors view any short-term correction as an opportunity to buy, maintaining the upward bias. As long as the price remains above this ascending support, analysts expect Ethereum to preserve its bullish trajectory.

ETH/BTC Pair Approaches Key Resistance
Conversely, the ETH/BTC monthly chart reflects a multi-year downtrend that started after Ethereum’s peak relative to Bitcoin in early 2021. Since then, the pair has tested and respected a descending resistance line, which has acted as a ceiling for several years. It is now approaching this line again, suggesting an inflection point that could redefine Ethereum’s performance relative to Bitcoin.

ETH/USD 1M Chart | Source: X
The structure displays two critical “oversold” zones one in 2019 and another between 2024 and 2025. These areas historically preceded strong rebounds where Ethereum outperformed Bitcoin over the following quarters. The pair is now trading near 0.036 BTC, just below the 0.038 BTC resistance. A confirmed breakout above this level could trigger a renewed altcoin rotation, allowing Ethereum to regain dominance during the next bullish phase.
Market Rotation May Favor Ethereum in 2025
Subsequently, if ETH/BTC successfully closes above its descending trendline, it could mark the start of a new capital rotation cycle. Historically, such shifts have favoured altcoins, with Ethereum leading early-stage rallies. This setup would fit well with the broader ETH/USD breakout pattern, reinforcing the argument for a synchronised move higher across pairs.
The overall chart structure resembles a rounding bottom formation, a classic sign of long-term accumulation. Should Ethereum sustain its momentum above current support zones, it may not only reach the projected $10,000–$12,000 range but also reassert its dominance within the crypto market.
Disclaimer: This is a Press Release provided by a third party who is responsible for the content. Please conduct your own research before taking any action based on the content.
Get 3 Free Stock Ebooks
Discover top-performing stocks in AI, Crypto, and Technology with expert analysis.
- Top 10 AI Stocks - Leading AI companies
- Top 10 Crypto Stocks - Blockchain leaders
- Top 10 Tech Stocks - Tech giants


