
 Slides to $2,100 as MVRV Metric Signals Historical Accumulation Zone")
Key Highlights
- The MVRV ratio for Ethereum has declined into the 0.8–1.0 range, a zone historically associated with market bottoms and value resets
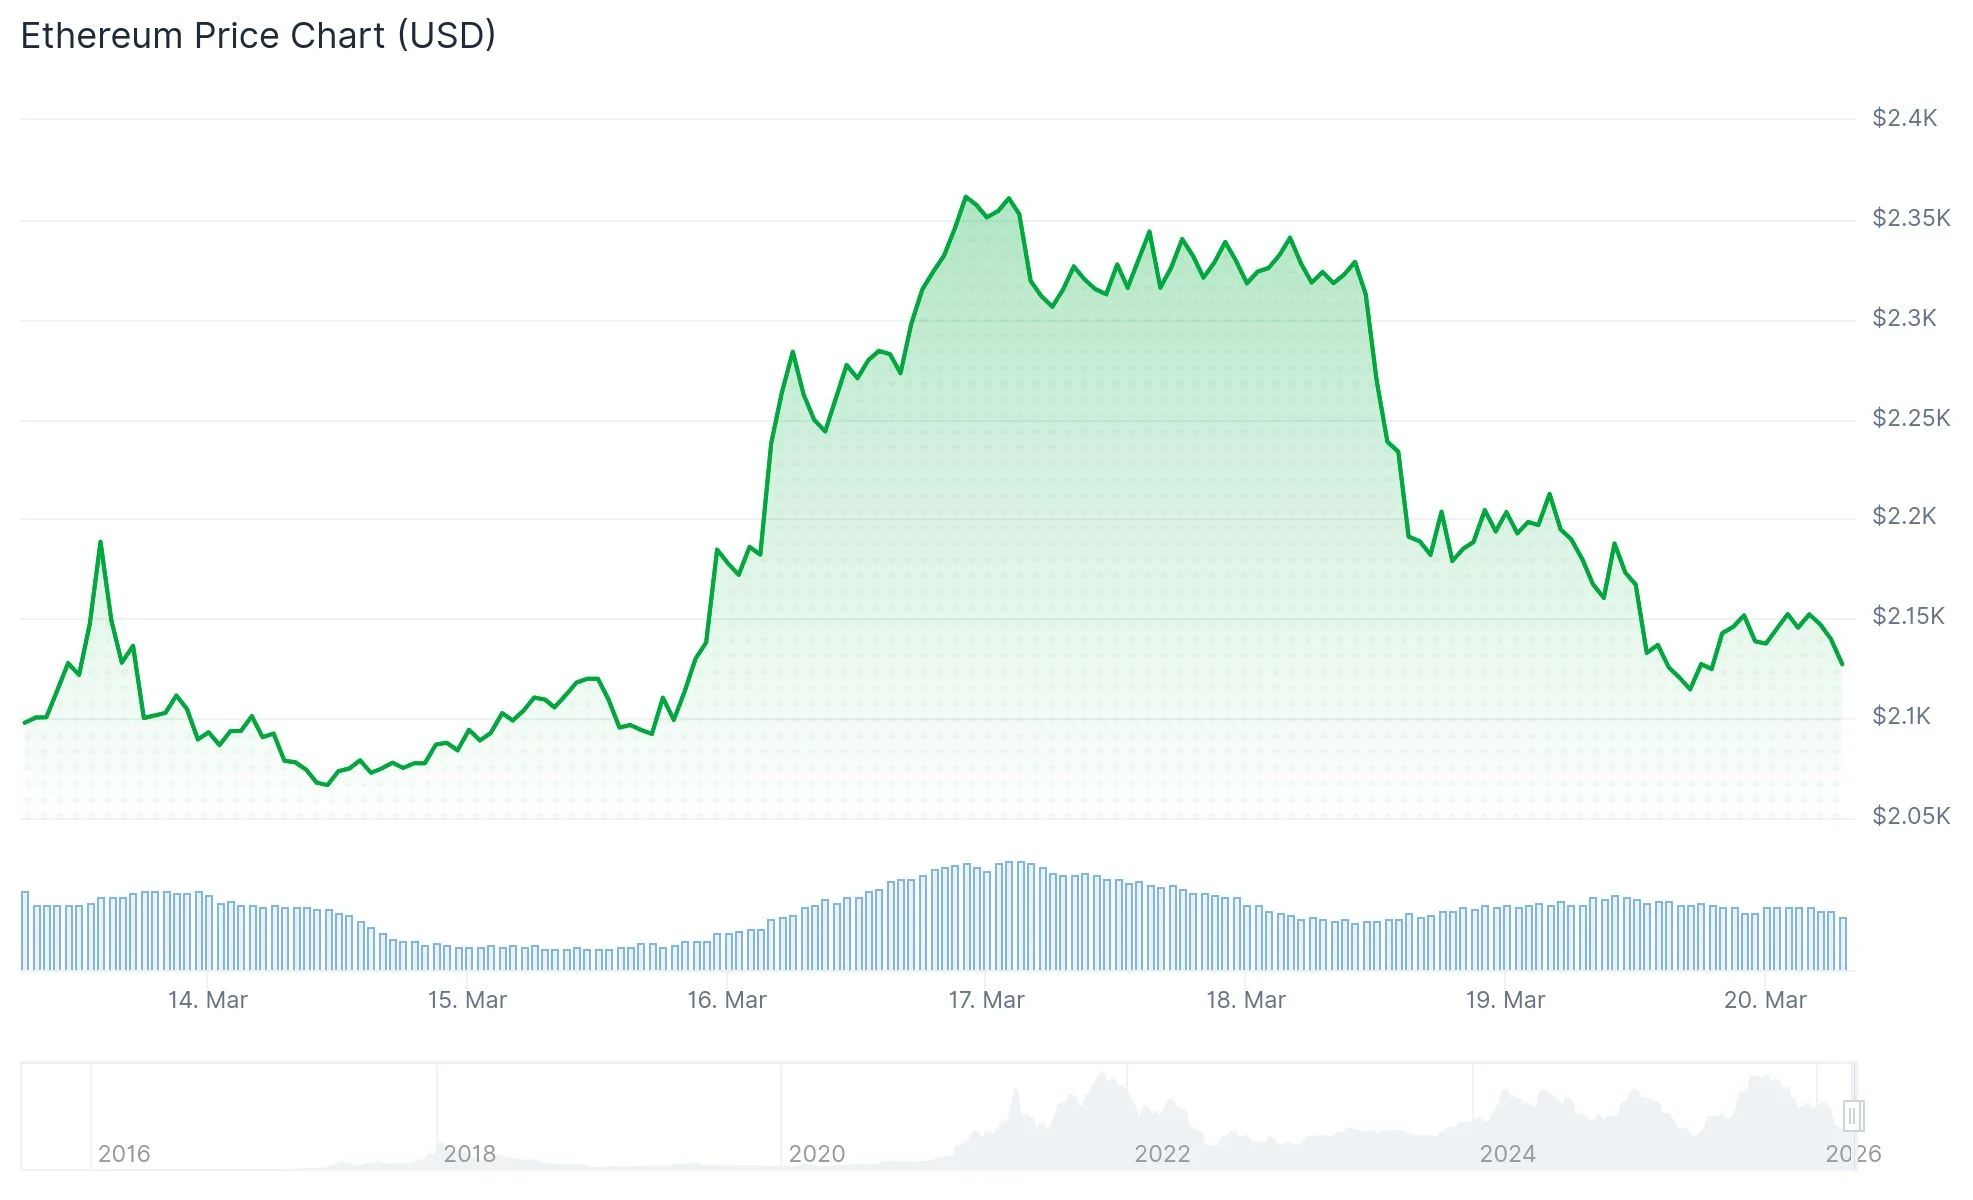
- Following a rejection near $2,400, ETH has fallen to approximately $2,100
- Current trading activity places ETH beneath the $2,200 mark and the 100-hour Simple Moving Average
- Critical near-term support exists between $2,100 and $2,150, with additional backing around $1,770 should current levels fail
- Breaking above $2,200 could trigger moves toward $2,240, $2,275, and possibly $2,385
Ethereum has retreated to the $2,100 region following a significant decline from $2,385. The digital asset breached multiple support thresholds at $2,320 and $2,250, ultimately breaking a critical ascending trend line that had provided stability near $2,160 on hourly charts.
The recent bottom touched $2,100, with ETH now consolidating slightly above this threshold. Current positioning places the asset below the 23.6% Fibonacci retracement level measured from the $2,385 peak to the $2,100 low.
Trading activity remains beneath the 100-hour Simple Moving Average, reinforcing the near-term bearish momentum.
Immediate resistance appears at $2,165, with the next significant barrier at $2,200 where the 100-hour SMA converges. Reclaiming the $2,200 level represents a crucial milestone for any potential reversal.
Should Ethereum manage to push through $2,200, traders will focus on $2,240, which aligns with the 50% Fibonacci retracement point, followed by $2,275 and $2,320. A more substantial rally could extend toward $2,385.

Regarding downside risk, a breakdown below $2,100 would expose support zones at $2,060 and $2,020. The psychological $2,000 threshold is widely viewed as a major support foundation.
Historical MVRV Metric Signals Potential Value Territory
From a broader perspective, Ethereum’s Market Value to Realized Value (MVRV) ratio has entered the 0.8–1.0 territory. Based on analysis from Ali Charts utilizing Glassnode metrics, this zone has historically preceded significant multi-month recovery periods.
https://twitter.com/alicharts/status/2034559606668570900?s=20
Historical recoveries from comparable MVRV levels have varied dramatically, ranging from approximately 129% to exceeding 5,000%, though market conditions differed substantially across cycles. While this metric doesn’t guarantee immediate price appreciation, it suggests potential downside may be increasingly constrained compared to earlier cycle highs.
ETH achieved a cycle peak near $4,955 before entering this correction phase. The present price around $2,100 marks a decline exceeding 57% from that maximum.
Technical Analyst Highlights $2,150 as Critical Pivot
Market analyst Ted Pillows shared insights on X regarding Ethereum’s technical formation. He observed that ETH experienced a decisive rejection at the $2,400 resistance area and is currently retesting $2,150 as prospective support.
https://twitter.com/TedPillows/status/2034554720593772615?s=20
The technical chart presented by Ted Pillows illustrates a sequence of declining peaks, with successive rallies unable to generate meaningful upward momentum. This formation maintains the possibility of additional downside movement should support levels fail to hold.
The $2,150 area corresponds with previous consolidation activity and serves as an important near-term inflection point for market participants.
Get 3 Free Stock Ebooks
Discover top-performing stocks in AI, Crypto, and Technology with expert analysis.
- Top 10 AI Stocks - Leading AI companies
- Top 10 Crypto Stocks - Blockchain leaders
- Top 10 Tech Stocks - Tech giants


