
 Sees Network Usage Surge But Price Plunges 50% Amid Capital Flight")
Key Takeaways
- Daily active addresses on Ethereum reached an unprecedented ~2 million in February 2026, representing twice the volume recorded during 2021’s bull run
- Daily smart contract interactions exceeded 40 million, marking a new all-time high
- ETH has plunged more than 50% over four months despite these network milestones
- Realized capitalization has flipped negative, indicating net capital outflows from the network
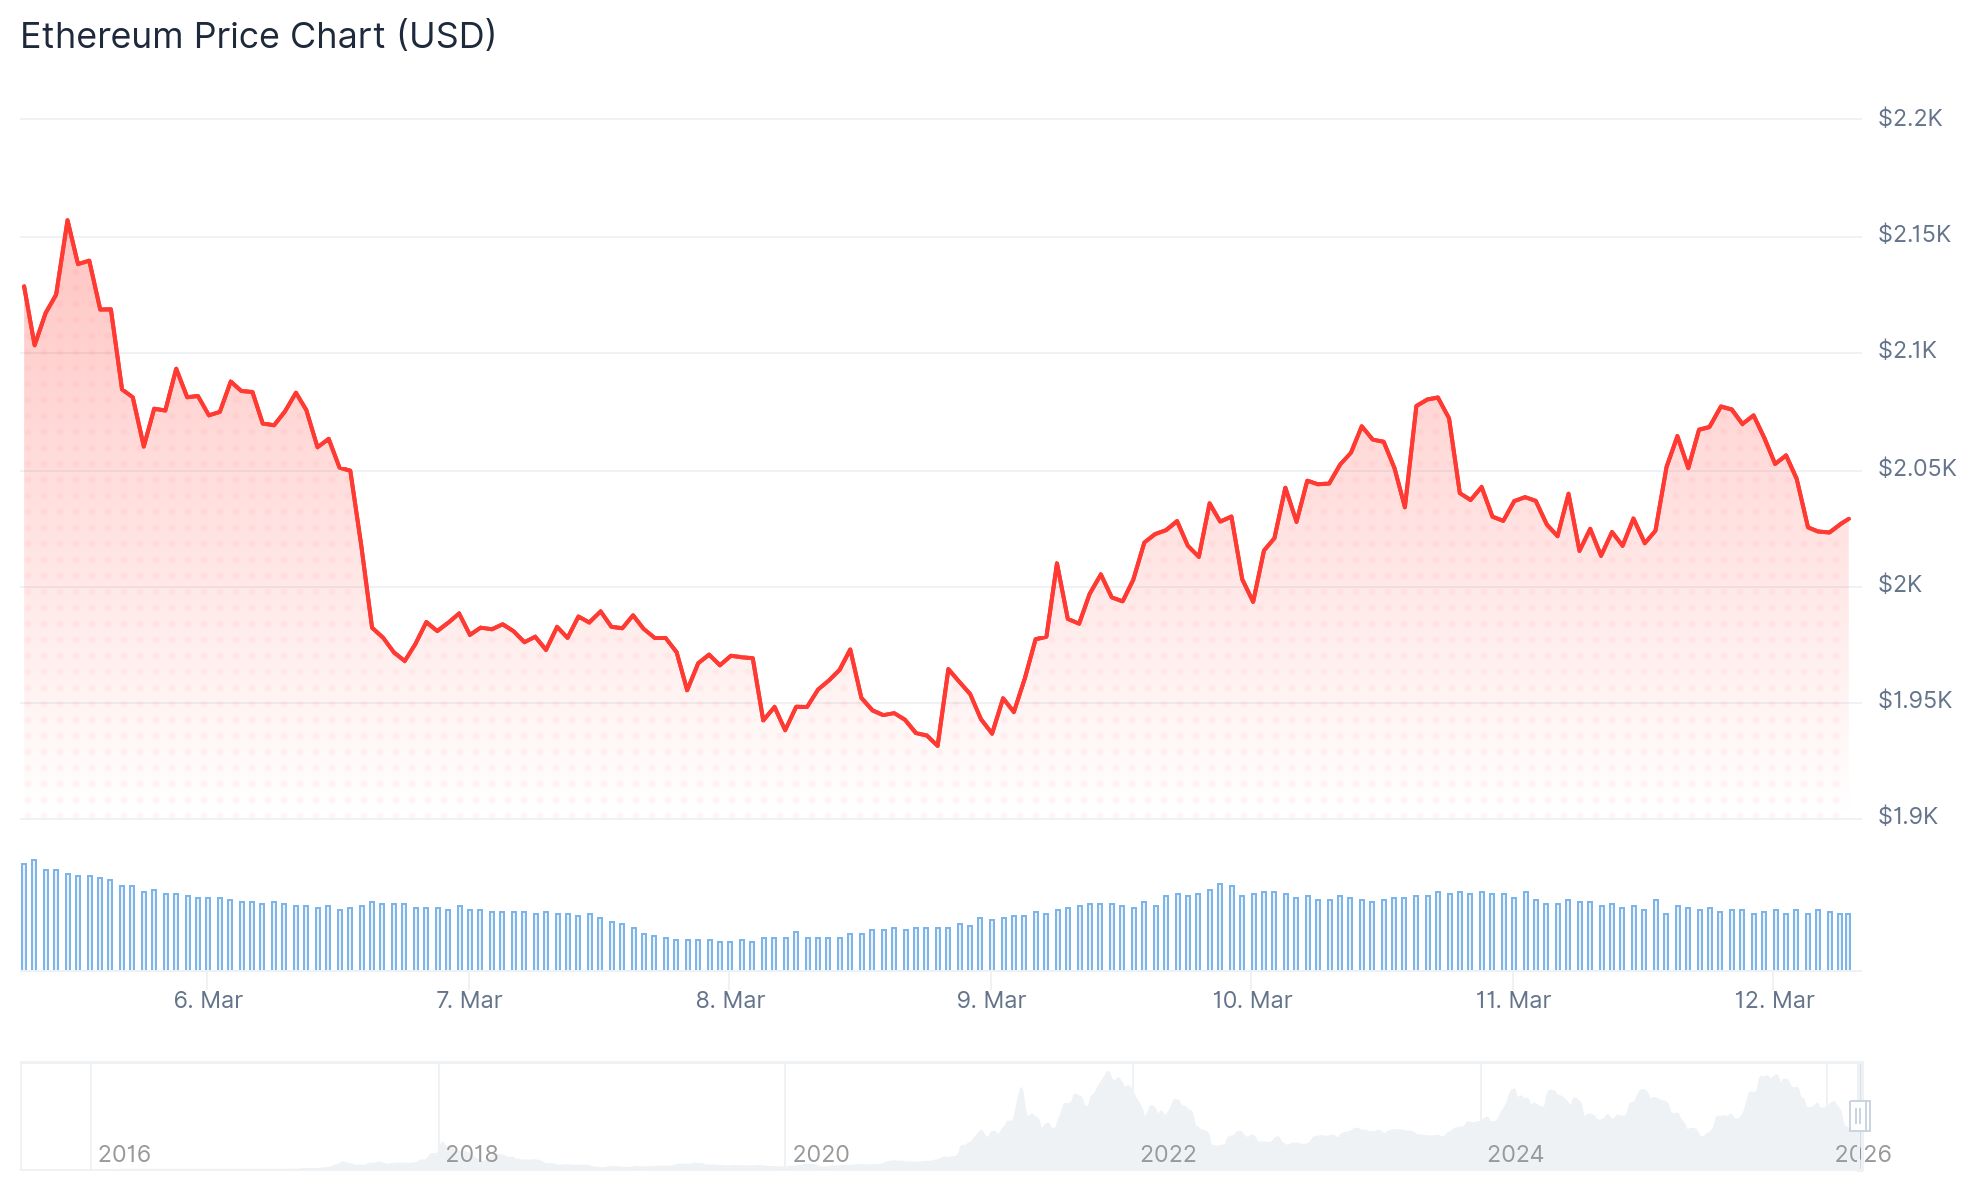
- Current trading range sits between $2,020 and $2,055, with critical resistance positioned at $2,080
The Ethereum network is experiencing unprecedented activity levels. Yet its native token’s price action paints a starkly contrasting picture.
Recent months have witnessed Ethereum blockchain metrics climbing to historic peaks. February saw daily active addresses touching approximately 2 million — a figure that doubles the highest point reached during 2021’s euphoric bull market phase, based on CryptoQuant analytics.
Smart contract interaction volume has similarly shattered previous benchmarks. Current daily contract calls are surpassing 40 million, significantly outpacing the levels observed during both the 2021 and 2018 market peaks.
Historically, such explosive network expansion has coincided with upward price momentum. This time proves dramatically different.
ETH’s value has collapsed by more than half across the previous four-month period. CryptoQuant researchers identify a decoupling between network utilization and token valuation.

“This deteriorating correlation indicates that Ethereum’s application-layer expansion is failing to translate into corresponding ETH price appreciation,” CryptoQuant analysts explained.
Net Capital Flight From ETH
The fundamental issue may center on capital migration patterns. ETH has registered greater exchange inflows compared to Bitcoin lately — indicating elevated selling pressure. This metric has traditionally correlated with local price peaks.
Ethereum’s realized capitalization — which tracks net capital movements into and out of the ecosystem — has shifted into negative territory. This signals that capital is exiting the network faster than new money enters.

During 2021, an ascending realized cap accompanied ETH’s most substantial price rallies. When this metric reversed to negative in 2022, prices tumbled dramatically. Current conditions mirror that earlier downturn.
Current ETH Price Action
Ethereum is presently changing hands around $2,020 to $2,055. The asset reclaimed the psychological $2,000 threshold after bouncing from $1,912 lows, though momentum has stalled near $2,080 resistance.
The 20-day exponential moving average rests near $2,024, with ETH maintaining a position marginally above this technical indicator. This level represents a crucial pivot point for near-term directional bias.
The 50-day EMA stands elevated at approximately $2,219, confirming that the intermediate timeframe trend remains bearish.
Should ETH successfully breach the $2,080–$2,135 resistance zone, subsequent upside targets include $2,200 and potentially $2,389. Conversely, downside support emerges at $1,980 initially, with $1,910 representing secondary defense.
The past 24 hours recorded $43.3 million in total liquidations — with short positions accounting for $24.6 million of that figure, per Coinglass data.
ETH maintains its grip on $2,000 support for the moment. Market participants are closely monitoring $2,080 as the next decisive inflection point.
Get 3 Free Stock Ebooks
Discover top-performing stocks in AI, Crypto, and Technology with expert analysis.
- Top 10 AI Stocks - Leading AI companies
- Top 10 Crypto Stocks - Blockchain leaders
- Top 10 Tech Stocks - Tech giants


