
 Price: Why Analysts Think $3,800 Could Be Next Target")
TLDR
- Ethereum (ETH) formed a bullish Morning Star candlestick pattern on monthly charts, suggesting potential upward momentum
- Spot Ethereum ETFs recorded $564 million in net inflows during May 2025, up from $66 million in April
- ETH must hold above $2,550 support level to maintain bullish momentum, with analysts targeting $2,650-$3,800
- Nearly 300,000 ETH left Binance between mid-April and mid-May, creating potential supply shortage
- Institutional investors are rotating capital from Bitcoin to Ethereum, with ETH securing $219 billion in total capital
Ethereum (ETH) Price Shows Bullish Signs as Technical Patterns Point to Potential Rally
Ethereum has posted gains of 37.7% over the past month despite trading over 33% below its June 2024 highs. Recent technical and on-chain data suggest the second-largest cryptocurrency may be positioning for further upward movement.
The monthly chart shows ETH has formed a Morning Star candlestick pattern. This three-candle formation typically signals a bullish reversal after a downtrend.
A Morning Star consists of a large bearish candle followed by a small indecision candle and then a strong bullish candle. The pattern appears when markets shift from selling pressure to buying interest.
Crypto trader Merlijn highlighted this development on social media platform X. The pattern’s completion suggests Ethereum may have found its bottom after recent declines.
Morning Star flashed on the monthly for Ethereum.
This is a macro reversal signal.
If history is any guide…
The bottom is in and the most hated rally is only getting started. pic.twitter.com/yhAeIHfODa
— Merlijn The Trader (@MerlijnTrader) June 2, 2025
Institutional Money Flows Into Ethereum
Institutional interest in Ethereum continues growing through exchange-traded products. Global crypto ETPs saw $286 million in net inflows during the week ending May 30.
Ethereum-based ETPs contributed to this trend. Spot Ethereum ETFs recorded $564 million in total net inflows during May 2025 alone.

This represents a sharp increase from April’s $66 million in inflows. The data comes from SoSoValue tracking services.
Monday saw Ethereum ETFs receive $78.2 million in net inflows. Bitcoin ETFs experienced $267.5 million in outflows during the same period.
CoinShares data shows Ethereum leading crypto fund inflows with its strongest performance since 2024. Institutional and retail investors currently prefer ETH over Bitcoin and XRP.
A Messari report reveals Ethereum has secured $219 billion in total capital as of May 28. This exceeds other major blockchains including Tron and Solana.
Staking activity also increased as entities continue locking ETH on the network. Abraxas Capital staked $7.5 million worth of ETH in a recent transaction.
Ethereum staking involves locking tokens to help secure the network and validate transactions. Participants earn rewards for supporting the proof-of-stake consensus mechanism.
Technical Levels and Price Targets
Veteran analyst Ali Martinez identified $2,550 as a critical support level for ETH. The cryptocurrency must hold above this threshold to maintain its bullish momentum.
If #Ethereum $ETH holds above $2,550, a rebound to $2,650 could follow, with the TD Sequential flashing a buy signal on the 4-hour chart. pic.twitter.com/Ec905hCL64
— Ali (@ali_charts) May 31, 2025
If support holds, Martinez predicts a potential move toward $2,650. Other analysts see higher targets based on chart patterns.
Titan of Crypto suggests ETH could reach $3,800 following a breakout from a bullish flag pattern. The analyst notes ETH currently trades above its 200-day exponential moving average.
This technical indicator often signals continued upward movement when price remains above it. Popular analyst Rekt Capital sees ETH attempting to reclaim $2,500 as support.
Ethereum is trying to reclaim $2500 as support and solidify it as the new Range Low of the $2500-$4000 Macro Range (black-black)
Ethereum is trying to repeat history and position itself in a similar way to the green circled retest of mid-2021#ETH #Crypto #Ethereum https://t.co/QWrvwwDrbe pic.twitter.com/z2LdB5Oxen
— Rekt Capital (@rektcapital) June 2, 2025
The price action resembles the parabolic run above $4,000 in mid-2021. A rally to $3,000 appears as the next region of interest for traders.
Michael van de Poppe identified a hidden bullish divergence on the ETH chart. This technical signal suggests readiness for an upward breakout.
Supply dynamics may support higher prices as nearly 300,000 ETH left Binance between mid-April and mid-May. Large exchange outflows often indicate investors moving coins to cold storage for longer-term holding.
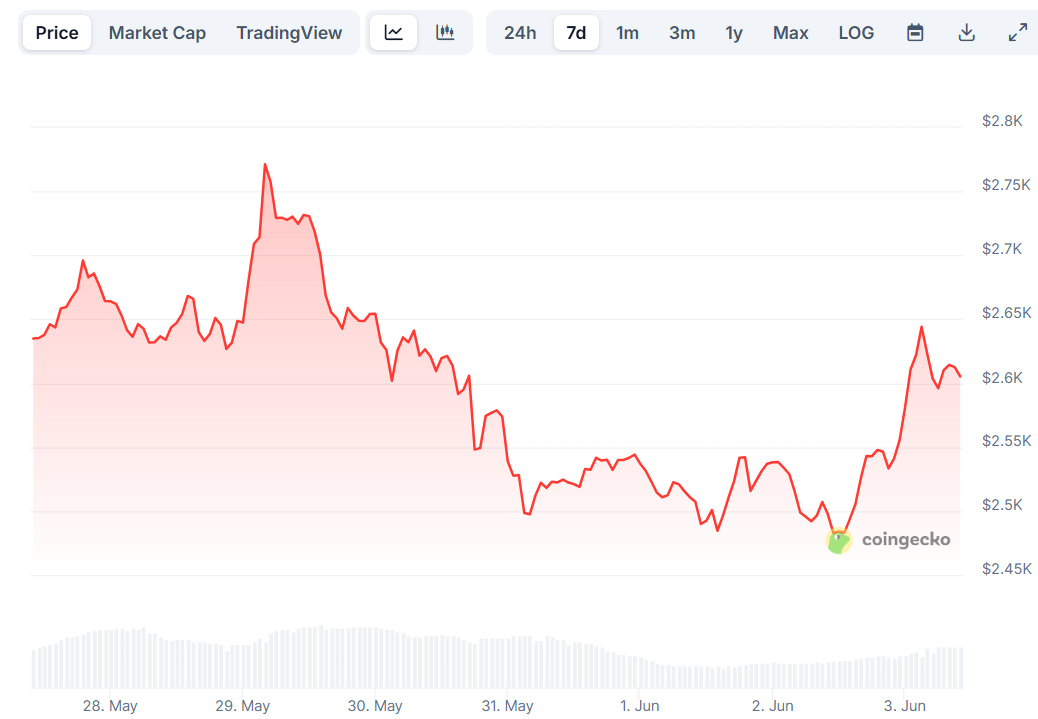
At the time of writing, ETH trades at $2,538, up 0.8% in the last 24 hours with increased trading volume.
Get 3 Free Stock Ebooks
Discover top-performing stocks in AI, Crypto, and Technology with expert analysis.
- Top 10 AI Stocks - Leading AI companies
- Top 10 Crypto Stocks - Blockchain leaders
- Top 10 Tech Stocks - Tech giants


