
 Price Update: Institutional Money Pours In While Resistance Zones Test Bulls")
Key Highlights
- Ethereum is currently valued at $2,316.20, registering a 2.08% gain over 24 hours
- Major investment firm Jane Street boosted its Ethereum ETF holdings by approximately $82 million during Q1 2026
- Significant whale-placed sell orders around $2,320 and $2,400 are limiting upward momentum
- Technical analysts identify $2,323 as the crucial breakout level for confirming bullish continuation
- Critical downside protection remains at $2,247, marked by the 50-day moving average
Ethereum maintains its position above the psychologically important $2,300 threshold as institutional capital inflows clash with concentrated whale resistance in determining near-term price trajectory.
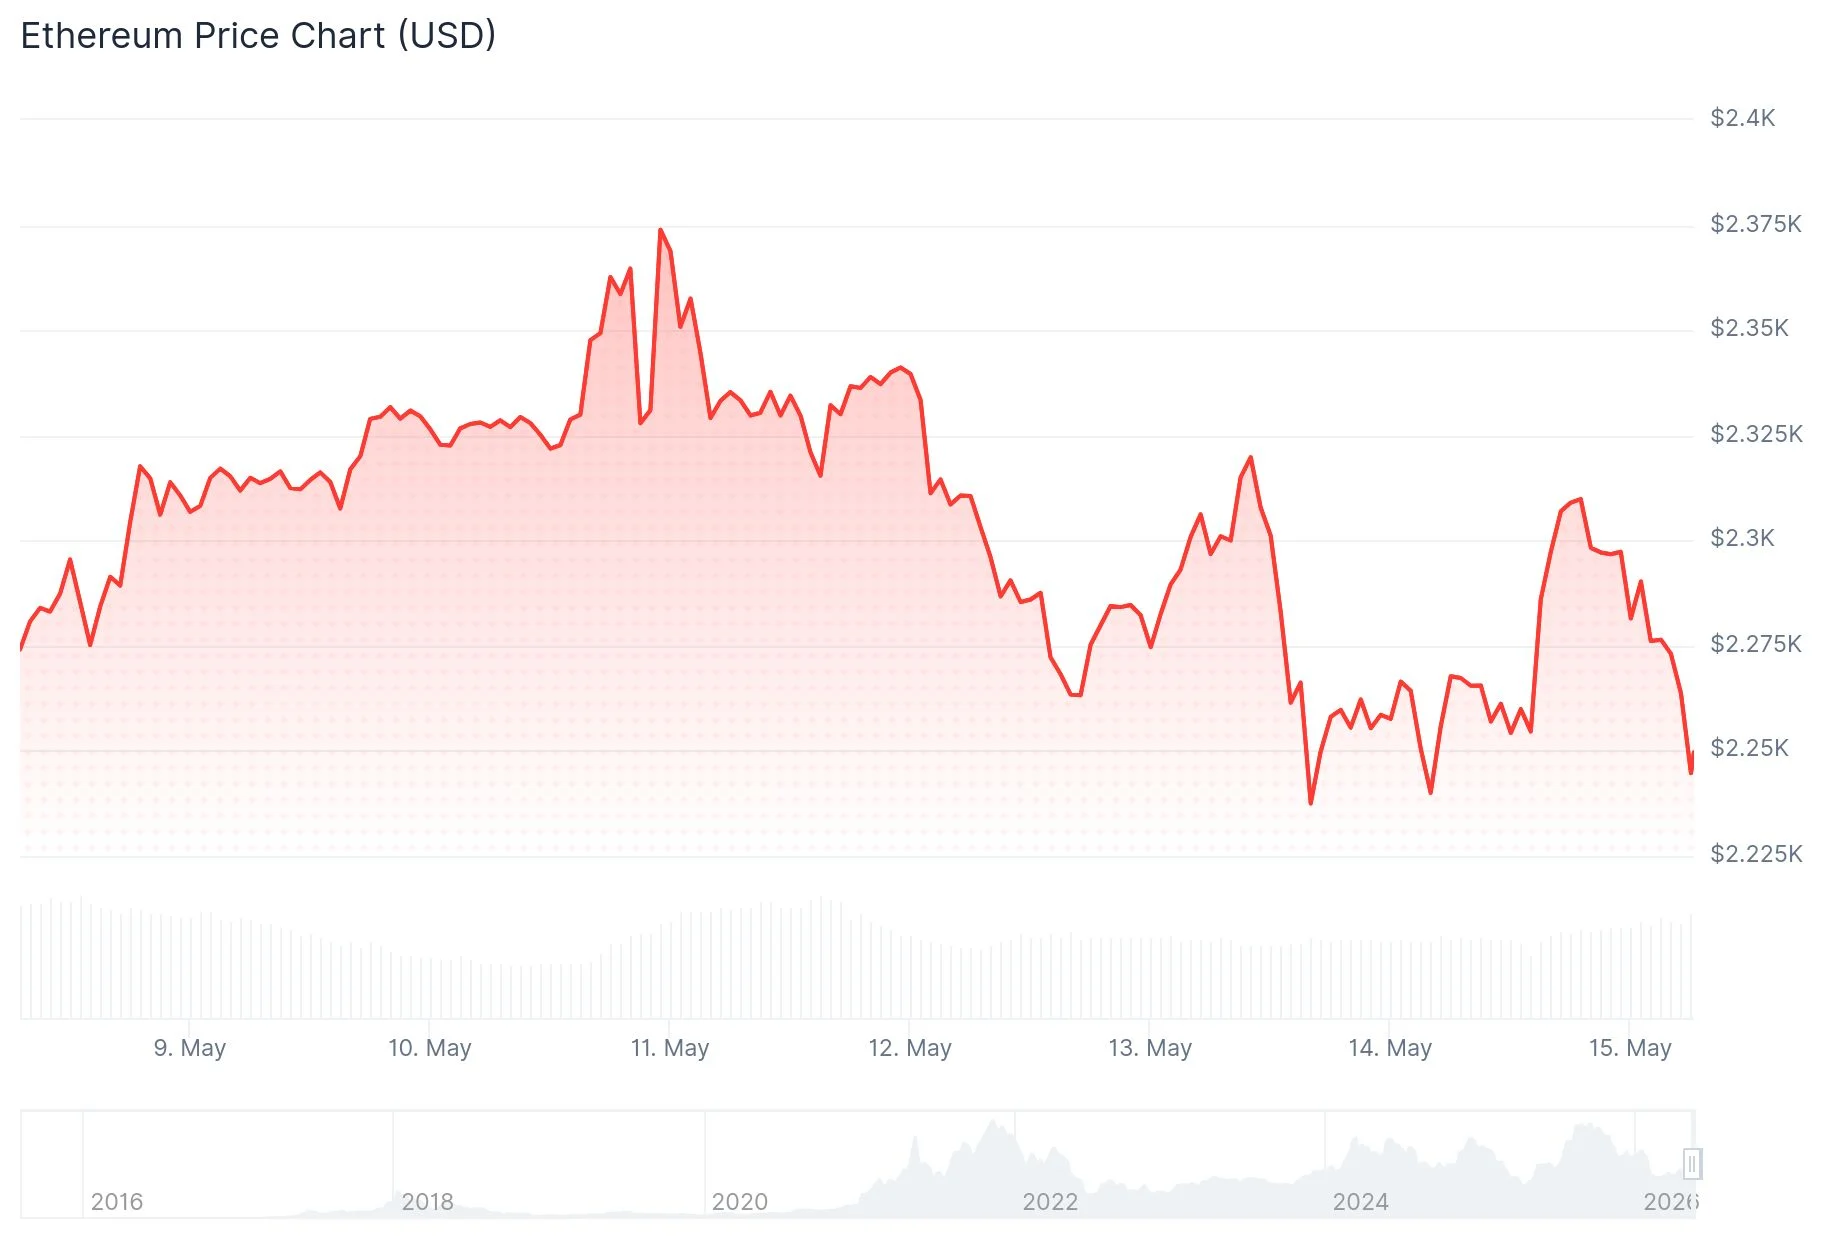
Current market data shows ETH changing hands at $2,316.20, reflecting a 2.08% increase from the previous day. The asset’s 24-hour trading activity totals $24.12 billion, while its overall market capitalization stands at $277.94 billion.
Market observer Ted Pillows highlighted on X that Ethereum recently revisited its $2,250 support threshold. According to his assessment, maintaining strength above this level could propel ETH toward the $2,350–$2,400 range, though failure to hold would likely send prices down to $2,150 or beneath. This observation aligns with current chart patterns.
On the corporate investment front, prominent financial institution Jane Street expanded its Ethereum ETF allocation by approximately $82 million during the first quarter of 2026. Interestingly, this move coincided with the firm scaling back its Bitcoin and MicroStrategy holdings.
Large Holder Sell Orders Create Resistance Ceiling
Cryptocurrency market analyst CW identified substantial sell pressure from Binance-based whales positioned near the $2,400 mark. Additionally, a secondary resistance layer from Coinbase whales exists around $2,320. These layered selling zones are effectively capping Ethereum’s recovery momentum.

ETH rebounded from recent lows around $2,233 but continues facing challenges in establishing sustained higher prices. The $2,320 threshold represents the initial hurdle bulls must overcome.
On May 14, blockchain analytics platform Alphractal observed that Ethereum’s “Realized Cap Impulse” metric maintained positive territory despite a 3% price decline. This data point indicates new capital continues flowing into the network even during consolidation phases.
Technical Indicator Breakdown
The Relative Strength Index presently registers at 49.94, hovering marginally beneath the neutral 50 threshold. The 50-day moving average is positioned at 52.88. Meanwhile, the MACD indicator shows the main line at 8.29, positioned below its signal line of 17.92, accompanied by a negative histogram reading of -9.63, suggesting weakening near-term momentum.
Chartist More Crypto Online indicates ETH’s Elliott wave formation implies a corrective phase may continue unfolding. The $2,220–$2,230 region represents the critical support zone that bulls must successfully defend.
Should ETH prove unable to surpass $2,323, chart analysis indicates potential retests of lower trend support zones. Conversely, clearing this resistance would establish $2,380 as the subsequent upside target.
Latest market readings confirm ETH stabilizing near $2,316, with institutional accumulation persisting as traders monitor pivotal technical thresholds for directional clues.
Get 3 Free Stock Ebooks
Discover top-performing stocks in AI, Crypto, and Technology with expert analysis.
- Top 10 AI Stocks - Leading AI companies
- Top 10 Crypto Stocks - Blockchain leaders
- Top 10 Tech Stocks - Tech giants


