
TLDR
- Ethereum currently hovers around $2,330, registering weekly gains of 12–14%
- Binance exchange deposits have declined to their lowest point in 10 months, easing sell-side pressure
- Large holders added 540,000 ETH to their positions over the past week, bolstering bullish momentum
- Spot Ethereum ETFs in the United States recorded $248 million in combined inflows across five trading sessions
- Critical resistance awaits at $2,388, while downside support zones exist at $2,260 and $2,150
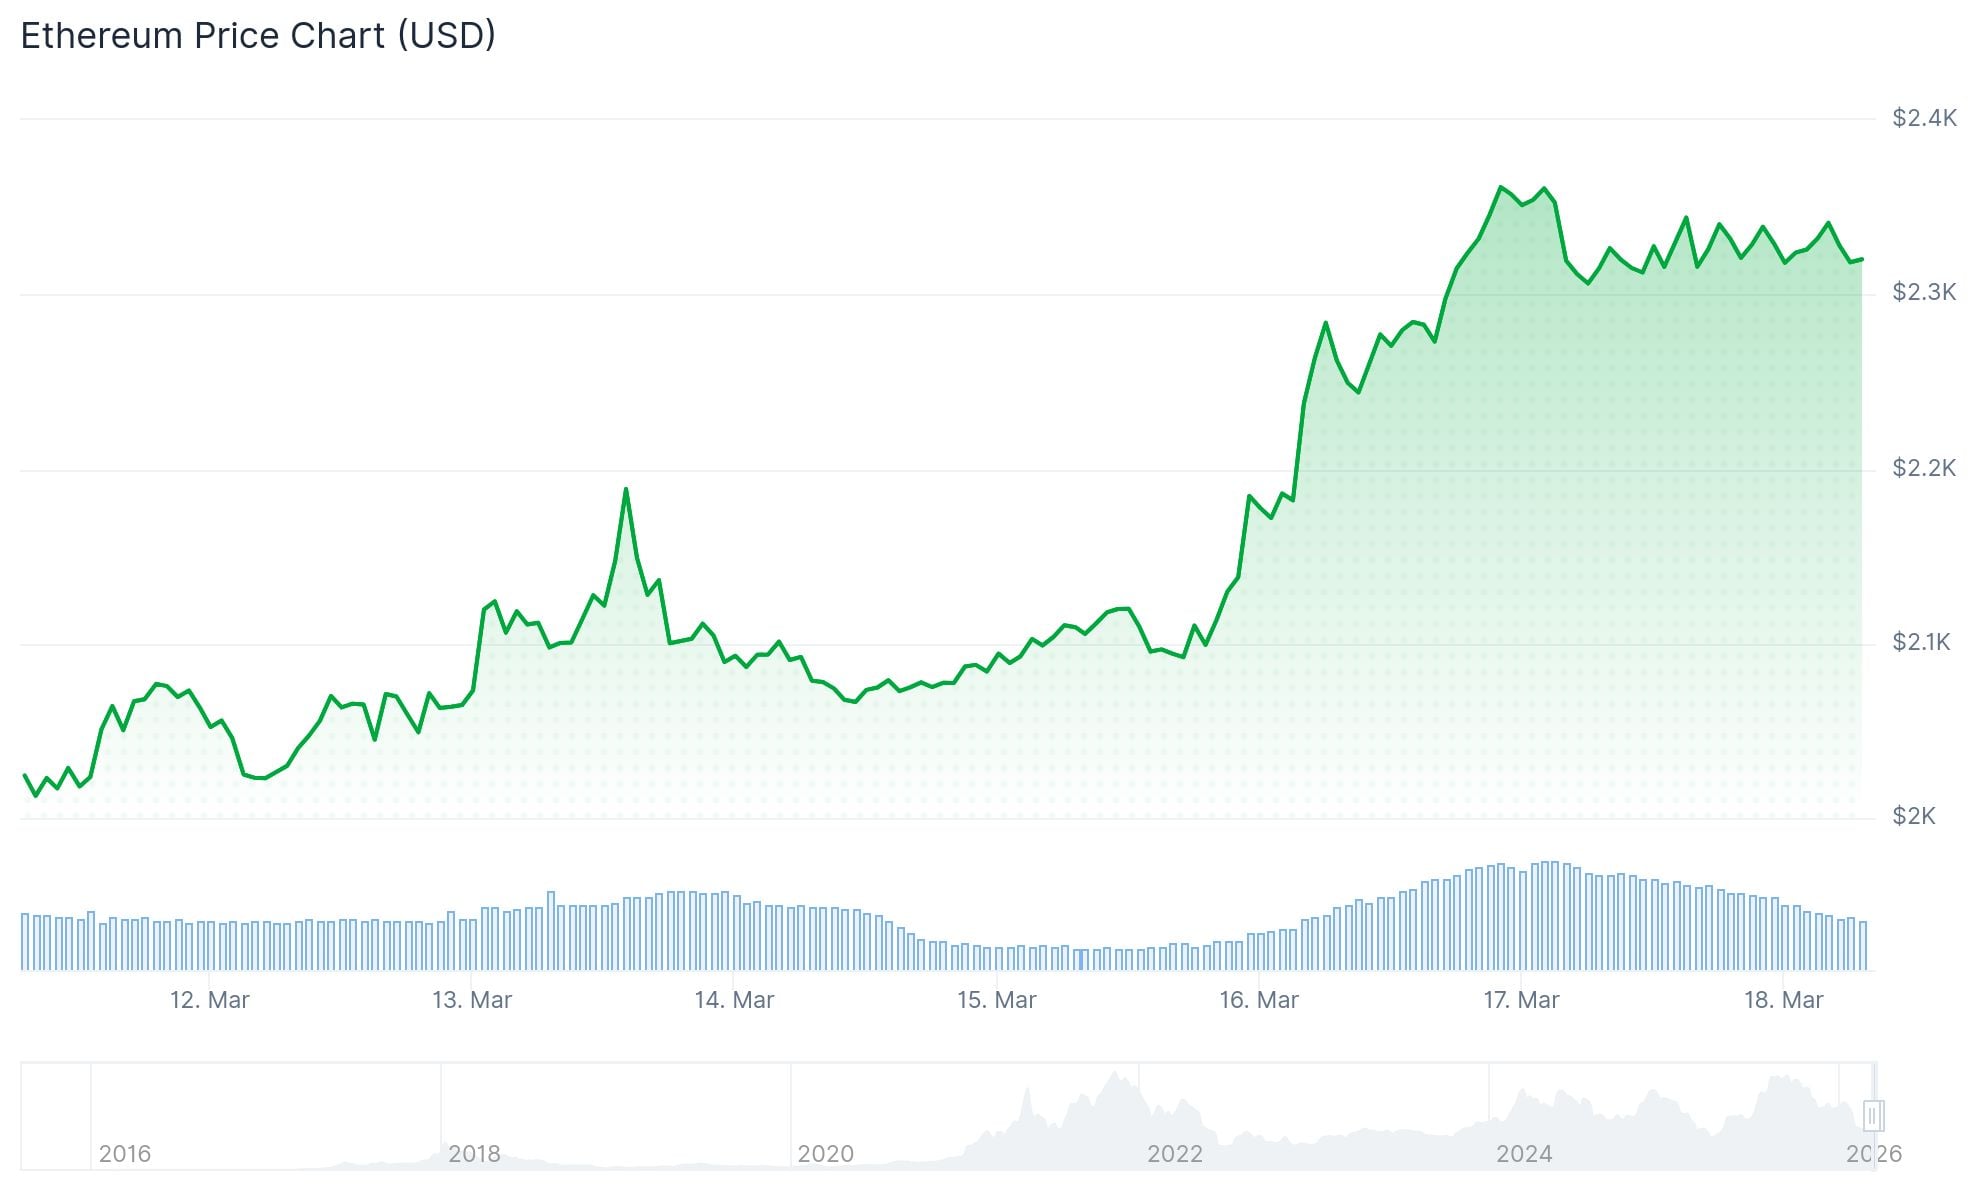
Ethereum has successfully reclaimed territory above the $2,300 threshold for the first time since the opening weeks of February, currently changing hands around $2,330 as of March 18, 2026.
The upward movement coincides with a significant contraction in exchange inflows, which have reached their most subdued levels over the past 10 months. Blockchain analytics from CryptoQuant reveal diminished ETH transfers to major platforms like Binance, a pattern historically associated with weakening bearish sentiment.
Market participants are increasingly transferring their holdings into self-custody solutions and cold storage rather than centralized trading venues. This behavior constricts circulating supply on exchanges and can amplify price volatility in response to changing demand dynamics.
ETH has also pushed above its realized price metric — representing the aggregate average acquisition cost across all network participants — currently positioned near $2,306. Market analysts frequently monitor this threshold as it tends to function as either resistance during downtrends or support during recoveries.
-1773782290321-1773782290322.png&w=1536&q=95)
Whale Accumulation Drives Recent Gains
Major addresses containing between 10,000 and 100,000 ETH increased their collective holdings by more than 540,000 ETH throughout the previous week. This concentrated buying from large-balance wallets has been recognized as a primary catalyst behind the current price strength.

Smaller retail participants, conversely, reduced their positions by approximately 370,000 ETH during the identical timeframe. Nevertheless, this distribution activity appears to be decelerating.
Exchange Netflow metrics indicate withdrawals have substantially exceeded deposits in recent weeks, providing additional confirmation of accumulation trends rather than distribution patterns.
Spot Ethereum exchange-traded funds in the United States logged five consecutive trading days of positive net inflows amounting to $248 million — marking the longest such sequence since middle of January.
Technical Levels to Watch
Ethereum is positioned above both its 20-day and 50-day exponential moving averages, currently located around $2,100 and $2,220 respectively. The Relative Strength Index maintains readings in the mid-60s, indicating sustained bullish momentum.
The nearest resistance barrier spans from $2,380 to $2,400. A confirmed breakout above $2,388 would establish a technical pathway toward the $2,500–$2,746 range.
Downside protection levels are identified at $2,320, $2,260, and $2,150. A breakdown beneath $2,260 could activate interest in a CME futures gap positioned at $2,117.
On March 17, blockchain data specialist CW highlighted that a fresh CME gap emerged at $2,117 following ETH’s completion of filling a previous gap. These chart gaps frequently exert gravitational pull on prices over subsequent trading periods.
ETH experienced $100.5 million in derivatives liquidations over the preceding 24 hours, with $68.2 million attributed to bearish positions being forcibly closed.
Longer-term monthly chart patterns show ETH defending a crucial support corridor between $1,900 and $2,100, a zone that has provided foundational price support during multiple historical tests.
Get 3 Free Stock Ebooks
Discover top-performing stocks in AI, Crypto, and Technology with expert analysis.
- Top 10 AI Stocks - Leading AI companies
- Top 10 Crypto Stocks - Blockchain leaders
- Top 10 Tech Stocks - Tech giants


