



Key Highlights
- June U.S. CPI registered at 3.5%, falling short of forecasted levels and igniting bullish sentiment across crypto markets
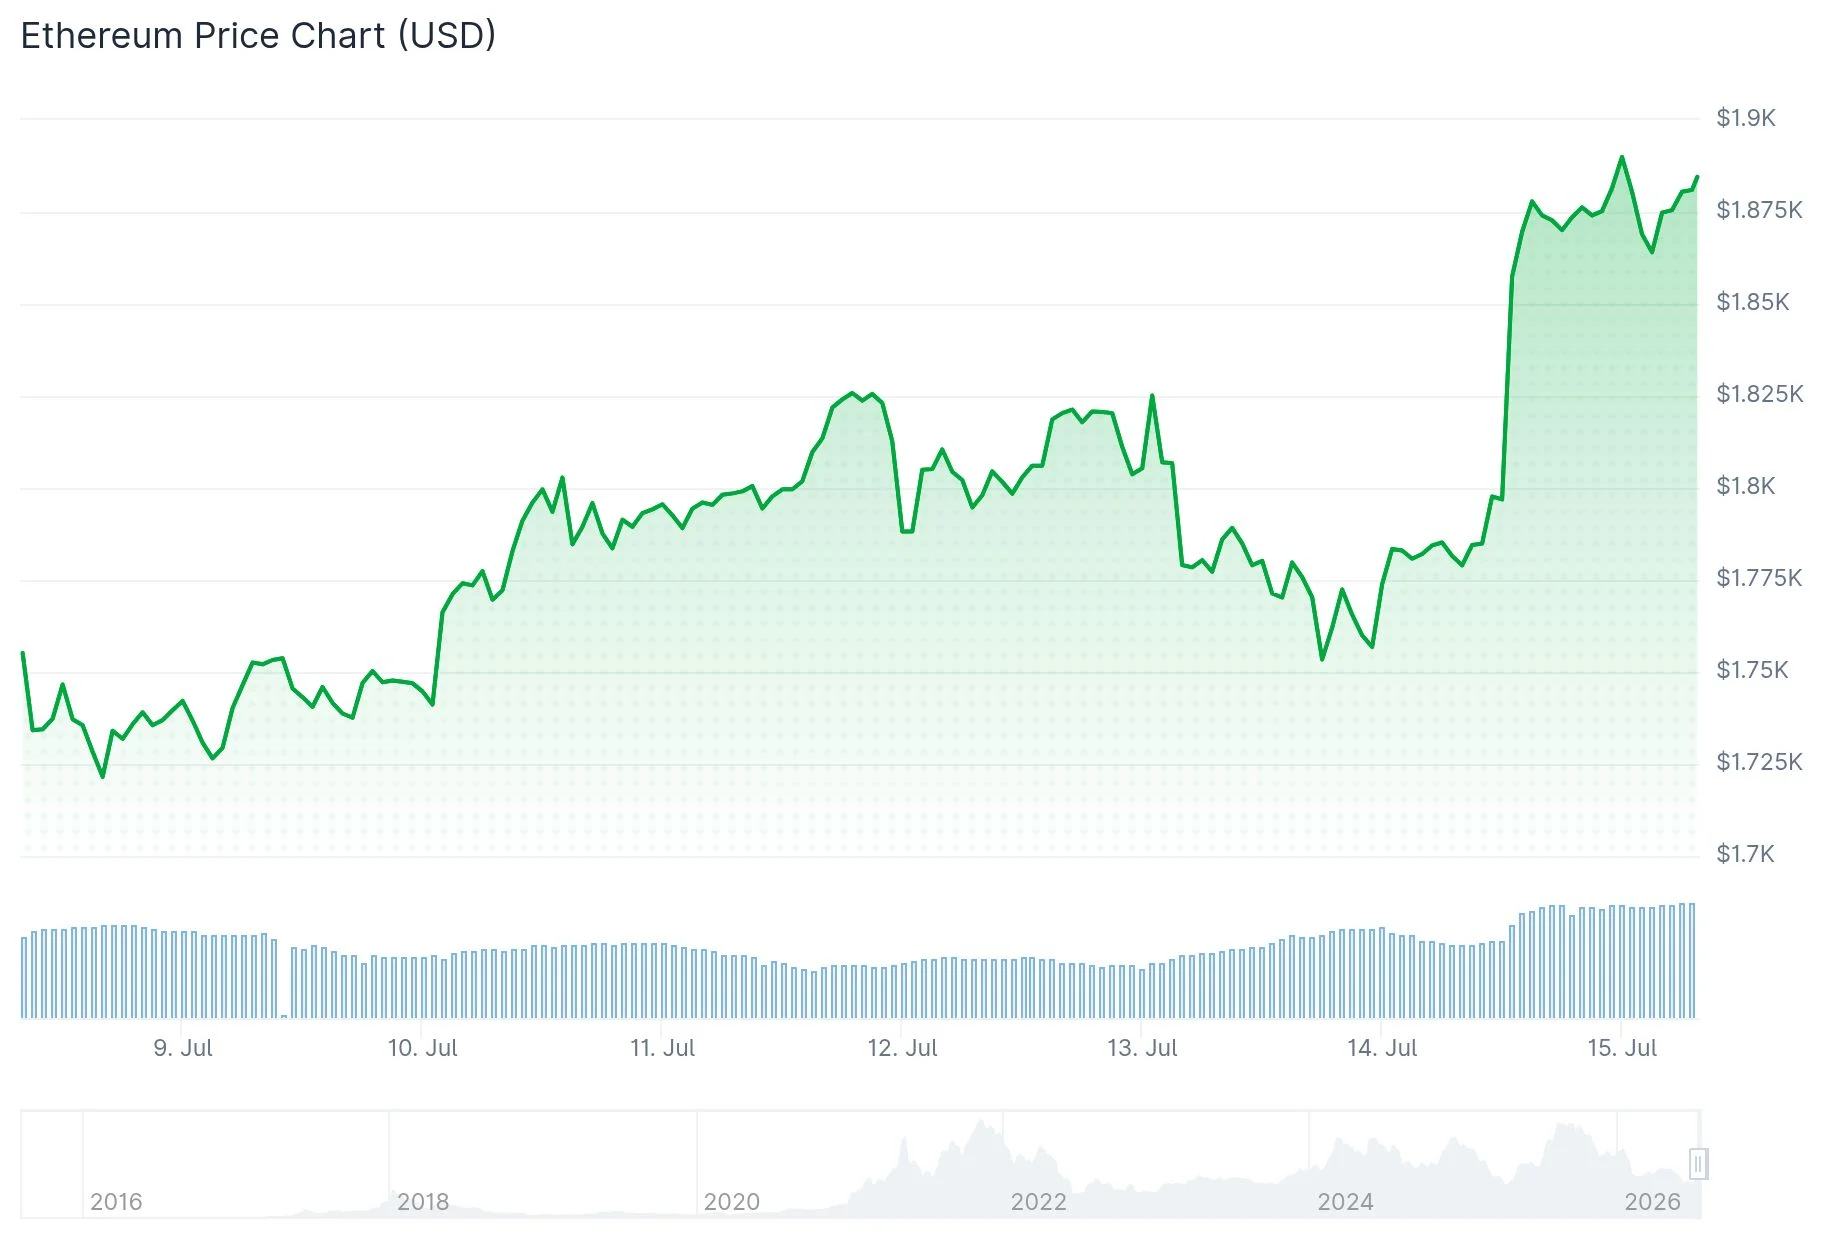
- Ethereum climbed more than 5% within 24 hours, smashing through the critical $1,800 resistance barrier
- Short liquidations totaled close to $300 million, with ETH representing over one-third of the wipeout
- Crypto analyst Ali Charts highlights that the SuperTrend indicator has flipped bullish on Ethereum’s 3-day timeframe
- The 200-day exponential moving average near $2,200 stands as the next critical hurdle, with $2,400 as the extended upside target
Ethereum has posted gains exceeding 5% over the past 24 hours following the release of softer-than-anticipated U.S. inflation figures for June.
The Consumer Price Index (CPI) climbed 3.5% on an annual basis for June. This reading landed 30 basis points beneath analyst forecasts. On a monthly basis, prices declined 0.4%, surpassing the 0.1% decrease that economists had anticipated.
Core inflation, which excludes volatile energy prices, also retreated by 20 basis points. This development is significant as it diminishes the Federal Reserve’s justification for implementing additional interest rate increases.
According to CME FedWatch data, the probability of the Fed holding rates steady in September surged from 25% to 39% within a single trading session. Although 61% of market participants continue to anticipate a rate adjustment, this notable shift indicates evolving macroeconomic conditions.
Risk-on assets such as cryptocurrencies typically rally when expectations for rate hikes diminish. Ethereum emerged as one of Monday’s primary beneficiaries.

Massive Short Liquidation Event Rocks ETH Markets
Ethereum pushed beyond the $1,800 threshold — a pivotal resistance zone — unleashing a cascade of forced short closures. According to CoinGlass metrics, approximately $300 million worth of short positions were eliminated within a 24-hour window.
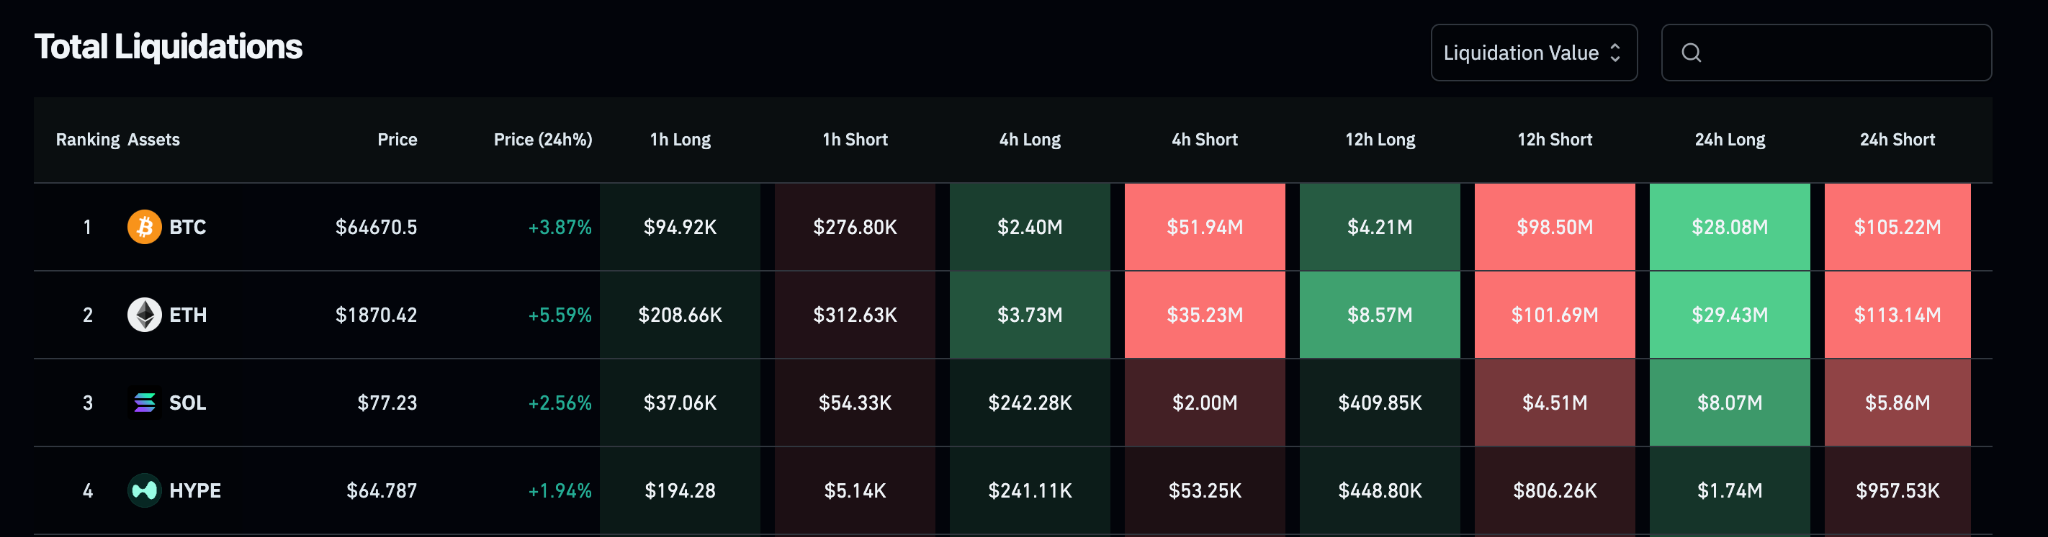
Ethereum accounted for more than one-third of these liquidations, briefly surpassing Bitcoin in this metric. This data reveals the substantial number of traders who had established bearish positions at that price point.
Market analyst Ted Pillows observed that ETH had maintained stability above the $1,750 support region prior to the breakout. He emphasized that buyers were consistently defending that level, and as long as this support remained intact, the next significant movement would likely trend upward. That foundation held firm, and the anticipated rally materialized.
Trading activity for Ethereum simultaneously increased by 33% during this timeframe. Elevated volume accompanying a price breakout is typically interpreted as a more robust confirmation signal compared to price action alone.
Prior to this move, ETH had established a double bottom formation at $1,550. This support level was tested and confirmed twice, producing a powerful rebound. The $1,800 mark represented the neckline of this technical pattern — a barrier Ethereum has now decisively breached.
Technical Indicators Signal Continued Upside Potential
The daily Relative Strength Index (RSI) also displayed a bullish divergence preceding this surge. While price action was trending lower, selling momentum was weakening. This configuration frequently precedes trend reversals.
Cryptocurrency analyst Ali Charts identified an additional technical development during this period. He highlighted that the SuperTrend indicator had just flipped to bullish on Ethereum’s 3-day chart. He noted that the previous two occurrences of this signal preceded rallies of 72% and 177% respectively.
The 200-day exponential moving average (EMA) is currently positioned around $2,200. This represents the next significant resistance level that bulls will monitor closely.
Should Ethereum successfully overcome $2,200, the subsequent target becomes $2,400. This price point also aligns with a longer-term bullish signal on the weekly timeframe, which emerged after the RSI fell below the oversold threshold of 30.
At the time of publication, ETH was changing hands near $1,850, reflecting gains of over 5% for the session.
Get 3 Free Stock Ebooks
Discover top-performing stocks in AI, Crypto, and Technology with expert analysis.
- Top 10 AI Stocks - Leading AI companies
- Top 10 Crypto Stocks - Blockchain leaders
- Top 10 Tech Stocks - Tech giants



