
 Price Plunges 8% Amid Geopolitical Tensions — Critical Support Levels to Monitor")
Key Takeaways
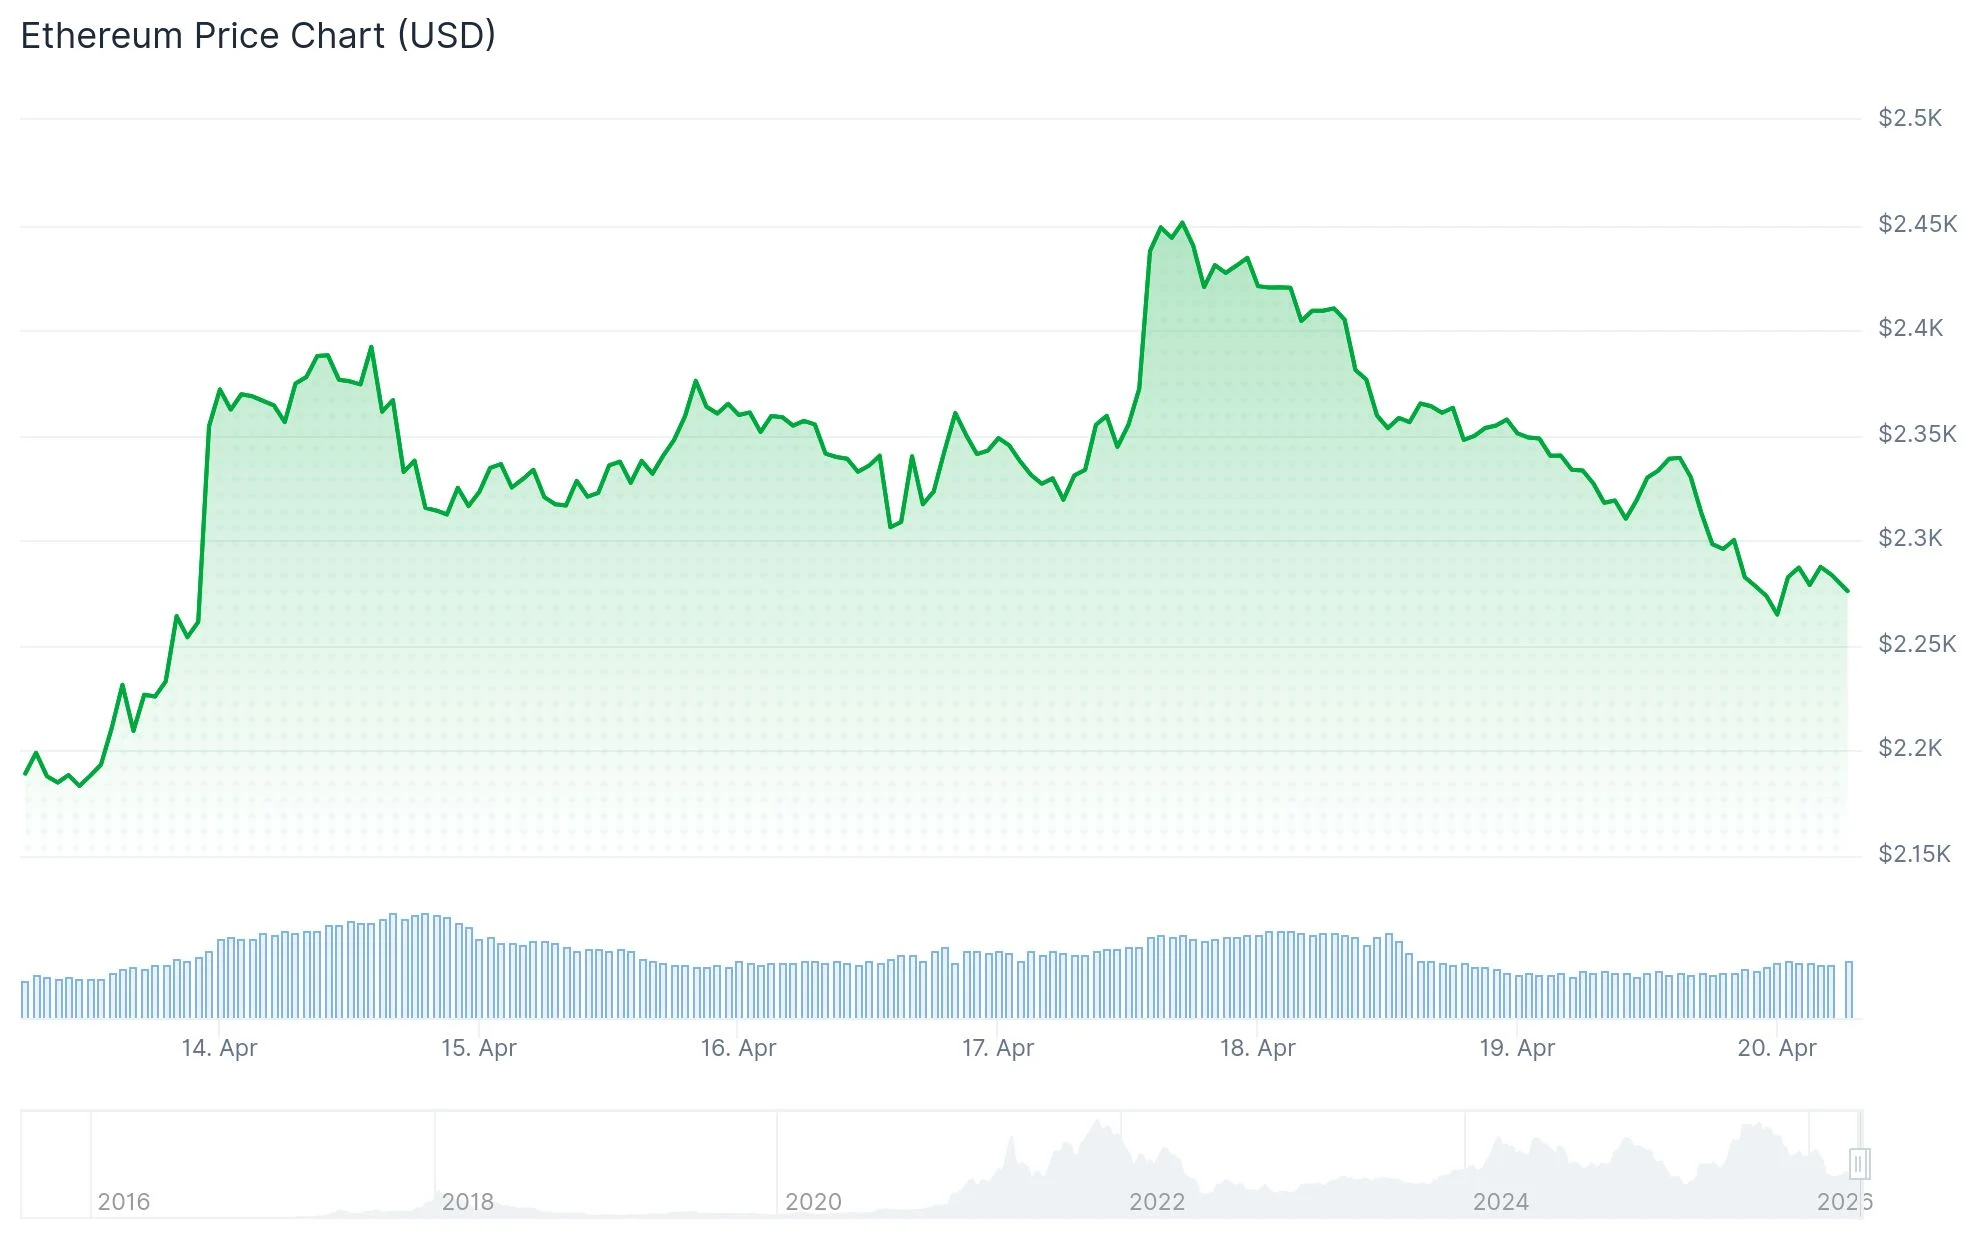
- Ethereum fell beneath the $2,350 threshold, currently hovering around $2,253 following a breakdown from $2,420
- Technical analysis reveals a descending trend line on the 60-minute chart with overhead resistance positioned at $2,300
- Spot Ethereum ETFs recorded $276 million in aggregate inflows during the previous week, with Fidelity’s FETH contributing $126 million
- More than 32% of the total ETH supply is currently locked in staking protocols, reducing exchange liquidity
- Taker Volume metrics have reversed to positive territory at approximately +$102 million since March, indicating renewed buying interest
Ethereum experienced a significant downturn, plummeting from $2,465 to a session low of $2,253 in a swift bearish movement. The asset is currently trading beneath both the 100-period Simple Moving Average on the hourly timeframe and the 23.6% Fibonacci retracement level calculated from the recent downswing.
Technical charts display a descending trend line on the ETH/USD hourly framework, establishing resistance at the $2,300 mark. The cryptocurrency is presently maintaining position slightly above the $2,250 threshold, which market observers identify as a crucial short-term floor.
Should Ethereum successfully defend the $2,250 zone, a recovery attempt may materialize. Initial overhead barriers emerge at $2,300, followed by $2,335. A decisive breakthrough above $2,360—corresponding with the 50% Fibonacci retracement of the latest decline—would potentially unlock pathways toward $2,415 and subsequently $2,465.
Conversely, failure to maintain $2,220 could trigger further weakness toward $2,200, followed by $2,150, with downside risks extending to $2,120.
Institutional Demand Remains Robust
Despite bearish price momentum, spot Ethereum exchange-traded funds accumulated $276 million in net capital during the April 13-17 trading period. Fidelity’s FETH dominated inflows with $126 million for the week, elevating its aggregate historical inflows to $2.36 billion.

BlackRock’s ETHA secured second position with $99.2 million in weekly contributions. ETHA’s lifetime net inflows have reached $11.83 billion. Grayscale’s ETHE represented the sole fund experiencing outflows, shedding $16.7 million during the same timeframe. Combined net assets across all Ethereum spot ETF products total $14.26 billion.
Supply Dynamics and Market Structure
Over 32% of the entire Ethereum supply is presently committed to staking mechanisms, effectively withdrawing substantial quantities from active market circulation. This dynamic constrains available inventory on trading platforms and gradually depletes order book depth.
According to CryptoQuant analytics, perpetual futures trading volume registered $34.74 billion against spot market volume of $14.29 billion, demonstrating trader preference for derivative instruments over direct purchases. Open interest contracted by 5.75% to $31.18 billion, while funding rates have shifted into slightly negative territory, suggesting increasing bearish positioning.
Neverthstanding, preliminary indicators suggest accumulation activity may be emerging. Net Taker Volume metrics have transitioned into positive territory at roughly +$102 million since March, reversing a previous pattern of sustained selling pressure that registered -$568 million during earlier rallies approaching the $5,000 level.
Current market data shows ETH changing hands below $2,350, with immediate price trajectory dependent upon whether buyers can successfully maintain the $2,250 support zone.
Get 3 Free Stock Ebooks
Discover top-performing stocks in AI, Crypto, and Technology with expert analysis.
- Top 10 AI Stocks - Leading AI companies
- Top 10 Crypto Stocks - Blockchain leaders
- Top 10 Tech Stocks - Tech giants


