
 Price: Institutional Money Flows In as Retail Traders Exit")
TLDR
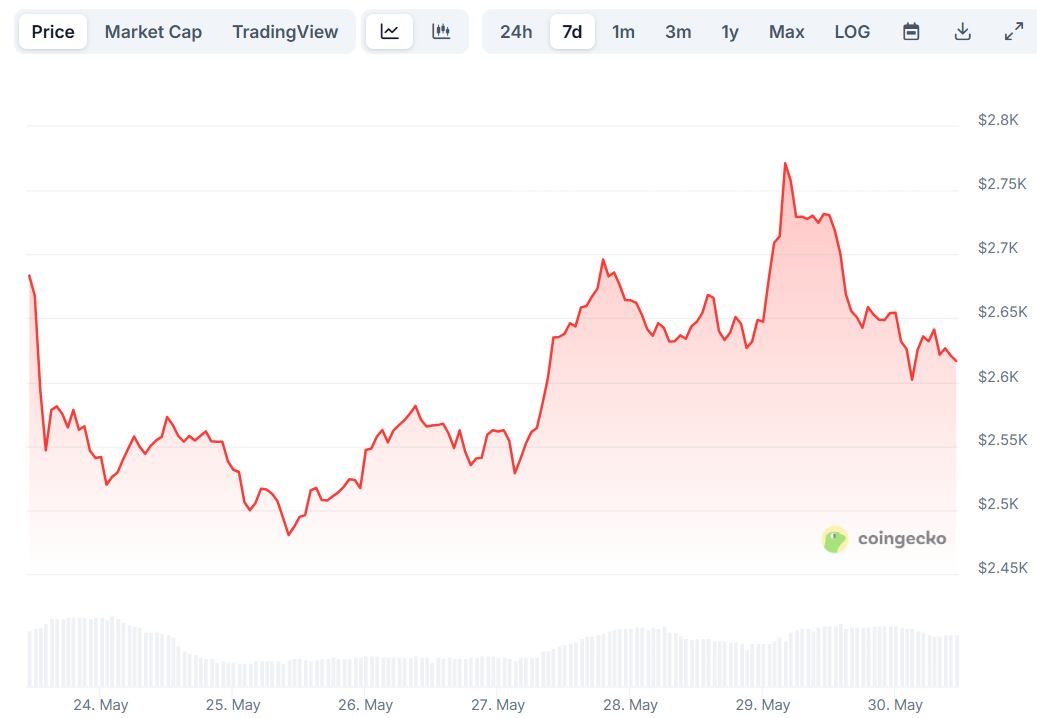
- Ethereum (ETH) experienced a price correction from $2,780, currently trading below $2,650 with technical indicators showing bearish momentum
- Ethereum ETFs attracted $71.3 million in recent inflows, with BlackRock leading at $32.5 million on May 27th alone
- ETH dominates cross-chain activity with the largest net inflow of bridged assets and strongest stablecoin supply growth
- Current price around $2,708 approaches local highs, with RSI at 70.47 indicating strong buying pressure but potential overbought conditions
- Key resistance sits at $2,720, with a breakout potentially targeting $2,900, while downside support remains at $2,550
Ethereum faces contrasting market forces as institutional money flows in through ETFs while technical charts show weakness. The second-largest cryptocurrency trades near $2,708 after declining from recent highs above $2,780.
ETF inflows tell a different story than price action. Ethereum-based exchange-traded funds pulled in $71.3 million in recent flows. BlackRock led this institutional interest with $32.5 million on May 27th alone.
The May 27th inflow marked one of the highest single-day totals since Ethereum ETF launch. ETHA and FETH products drove most of the capital rotation. This follows net positive flows during the third week of May.
$ETH ETF inflow + $38,800,000 yesterday.
Blackrock bought another $32,500,000. 🔥 pic.twitter.com/CT1Uktbr6X
— Ted (@TedPillows) May 28, 2025
Fidelity and Franklin had caused earlier volatility with outflows. The recent reversal shows renewed confidence from major asset managers. Institutional accumulation appears to be building momentum.
On-Chain Metrics Support Bullish Case
Ethereum dominates across multiple network metrics beyond ETF flows. Recent data shows ETH leading all networks in bridged net flows. The network also posted the strongest stablecoin supply growth.

Cross-chain bridge activity reveals capital moving into Ethereum protocols. Stablecoin issuance increases suggest rising liquidity confidence. Both metrics point to renewed DeFi protocol usage.
This dual leadership reinforces Ethereum’s position as crypto’s primary Layer 1 network. On-chain fundamentals appear stronger than price action suggests.
Technical Analysis Shows Mixed Picture
Ethereum’s price chart presents conflicting signals for traders. The cryptocurrency broke below key support at $2,650 and the 100-hourly moving average. A bullish trendline with support at $2,625 also failed.
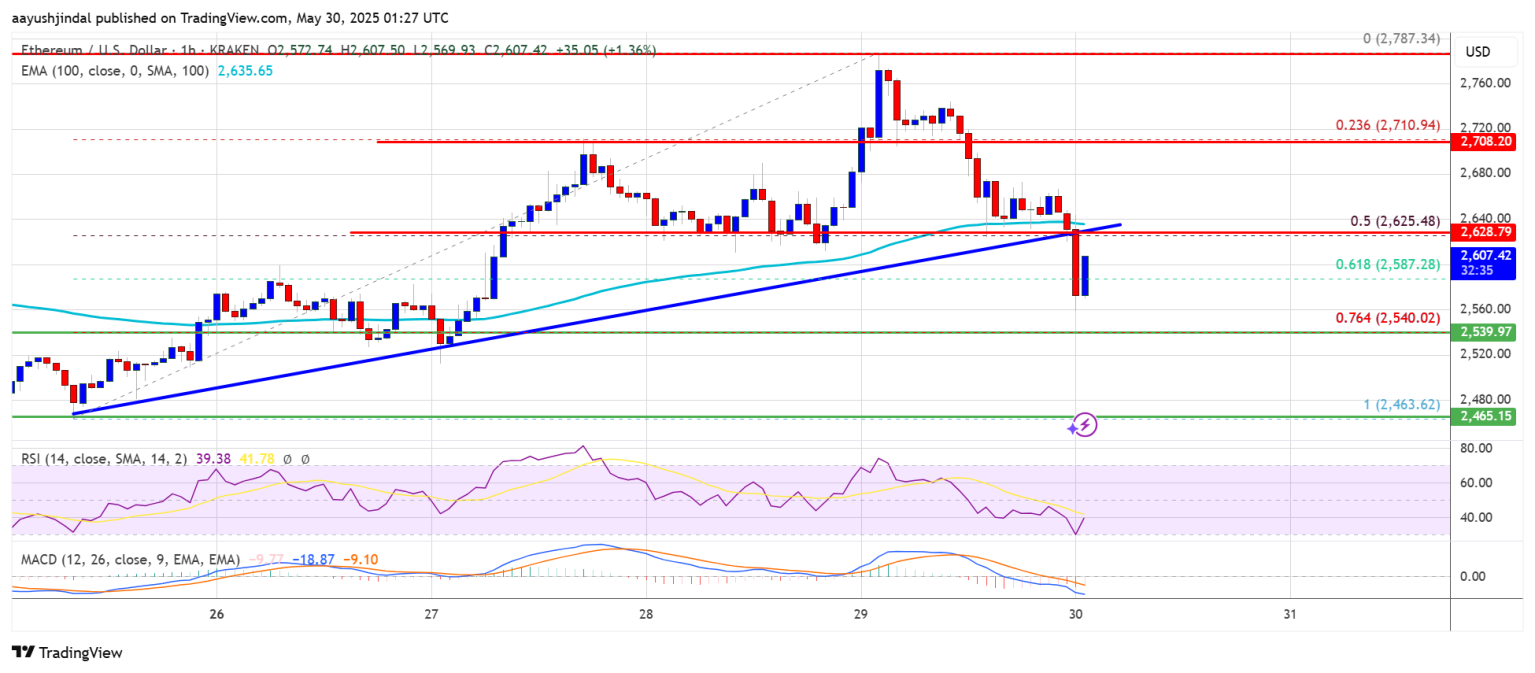
Current price action sits below the 50% Fibonacci retracement level. This measures the move from the $2,463 swing low to the $2,787 high. The MACD indicator shows bearish momentum building.
RSI readings tell a different story at 70.47. This level approaches overbought territory but shows strong buying pressure. The Chaikin Money Flow remains positive at 0.15, indicating steady capital inflows.
Resistance levels create the key battle zone ahead. The $2,625 level provides initial resistance, followed by $2,650. Major resistance sits at $2,720, with $2,780 representing the recent high.
A clear break above $2,720 could target $2,880 or even $2,950. However, failure to reclaim $2,650 might trigger fresh selling. Support levels rest at $2,600, $2,550, and $2,500.
The $2,550 zone aligns with the 76.4% Fibonacci retracement level. This represents critical support for the broader uptrend. Any break below could target $2,440 or $2,400.
Current trading around $2,708 keeps both scenarios in play. Volume and momentum will determine which direction prevails in coming sessions.
Get 3 Free Stock Ebooks
Discover top-performing stocks in AI, Crypto, and Technology with expert analysis.
- Top 10 AI Stocks - Leading AI companies
- Top 10 Crypto Stocks - Blockchain leaders
- Top 10 Tech Stocks - Tech giants


