
 Price: Critical $2,040 Support at Risk as Bearish Pattern Emerges")
Quick Summary
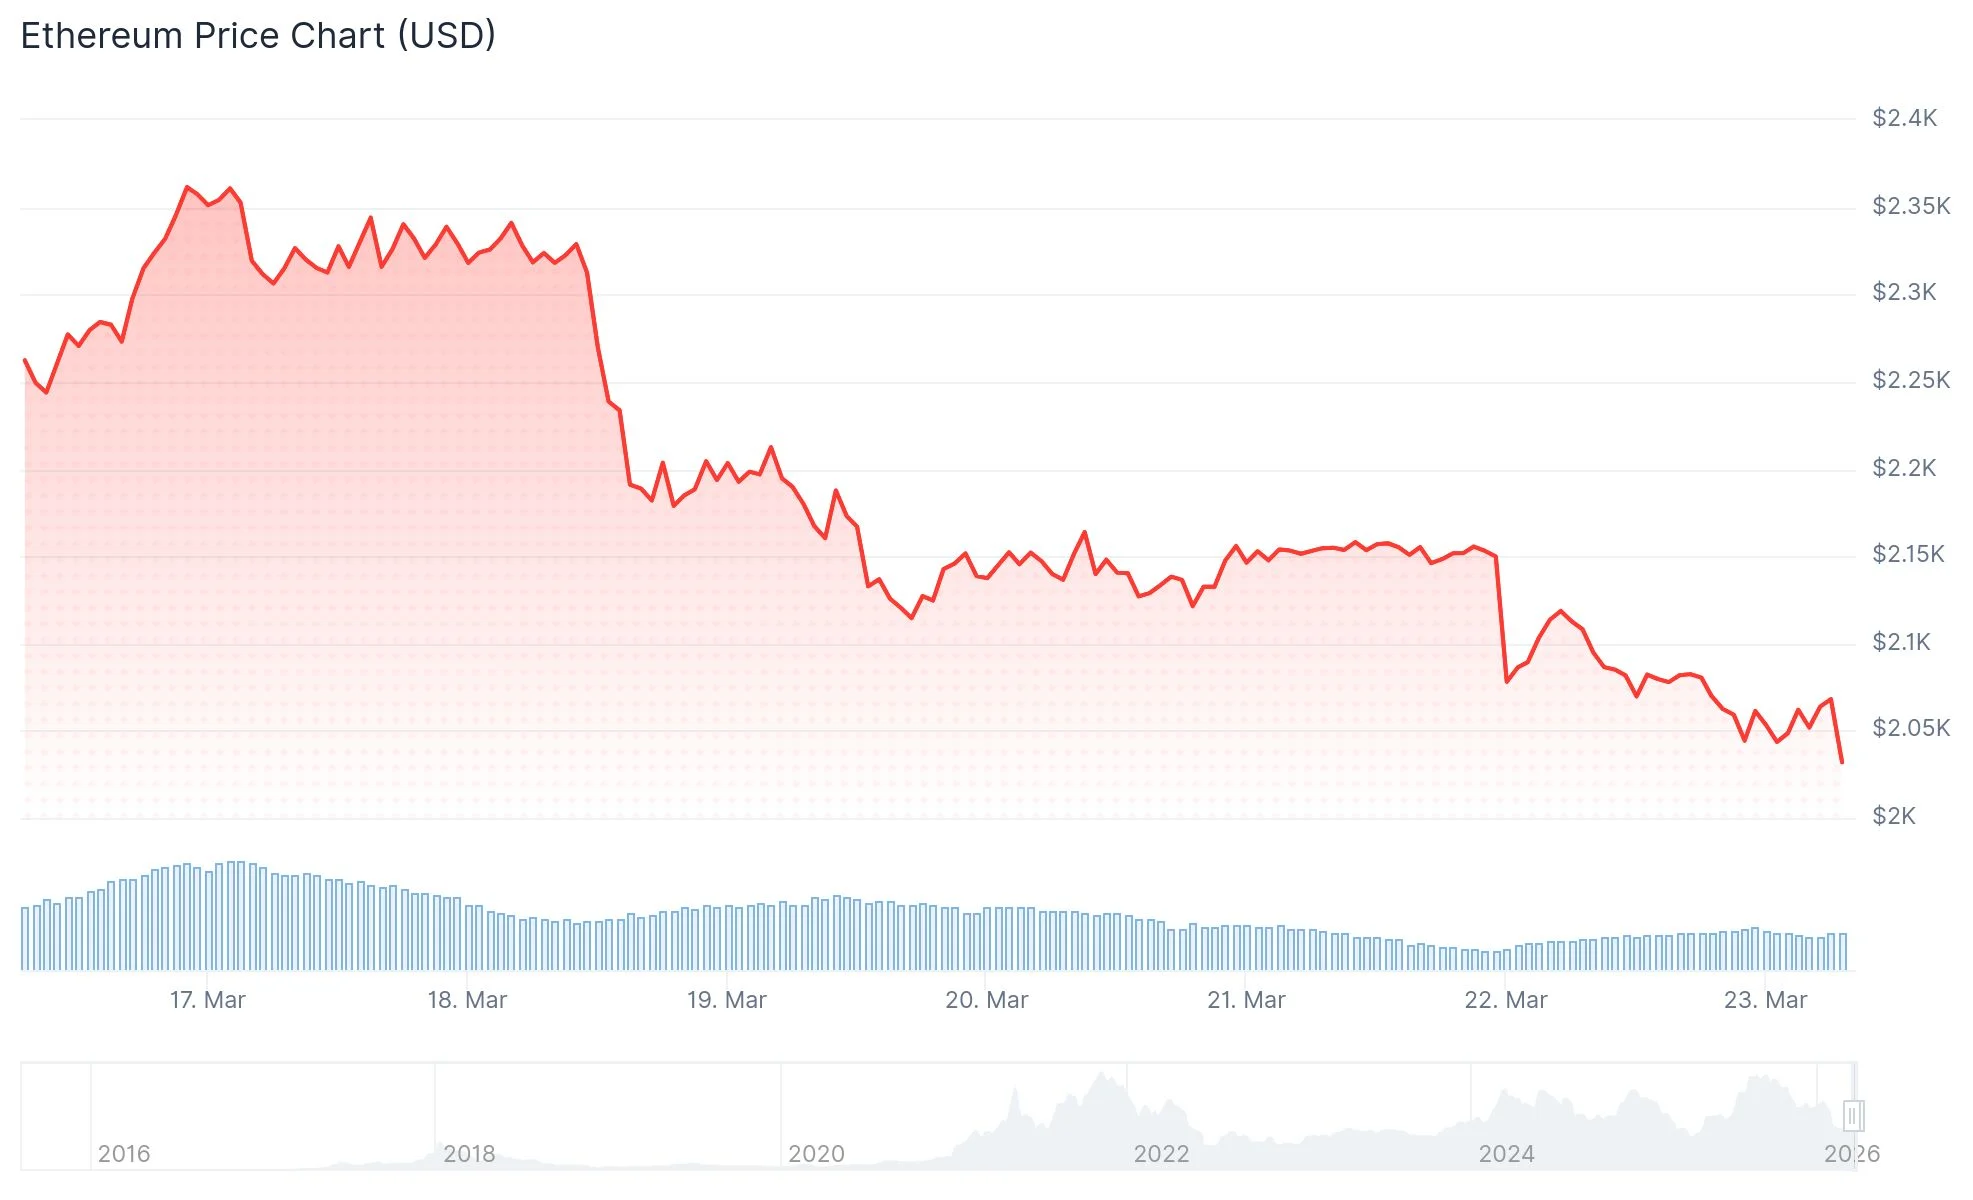
- Ethereum declined from $2,220 to a bottom of $2,025, currently range-bound between $2,020–$2,100
- Dual bearish trendlines present resistance barriers at the $2,120 and $2,165 levels
- Breaking resistance at $2,165 may drive ETH toward the $2,200–$2,300 zone; losing $2,025 support threatens a move to $2,000 or beneath
- Last week witnessed $59.94 million in net outflows from Ethereum spot ETFs, primarily from BlackRock’s ETHA with $69.59 million
- Combined Ethereum spot ETF net assets total $12.33 billion, accounting for 4.79% of ETH’s market capitalization
Ethereum experienced a sharp pullback in recent trading sessions, tumbling from approximately $2,385 down to $2,025. The cryptocurrency now changes hands beneath the $2,100 threshold and its 100-hourly Simple Moving Average.
The downturn initiated after ETH struggled to sustain levels above $2,220. Price action subsequently pierced through $2,150 and $2,120 support zones before momentarily touching below $2,050.
Presently, ETH consolidates beneath the 23.6% Fibonacci retracement of the decline from $2,385 down to $2,025. Technical analysis reveals two descending trendlines on the hourly timeframe, establishing resistance zones at $2,120 and $2,165.
The initial resistance hurdle appears at $2,120, coinciding with the 100-hourly Simple Moving Average. Successfully clearing this barrier would bring the $2,165 level into immediate focus.
Should Ethereum breach $2,165, traders will watch the 50% Fibonacci retracement near $2,200. Momentum beyond this area could target $2,250 with further extension toward $2,300.

Critical Support Zones Under Watch
Regarding downside protection, immediate support emerges around $2,040. Beneath this threshold, $2,025 represents the primary support foundation.
A definitive breakdown below $2,025 would shift attention to the psychological $2,000 mark. Additional weakness might expose the $1,965 level, while $1,880 serves as extended support territory.
Technical analyst Ted Pillows identified on X that Ethereum may be developing a head and shoulders formation. His analysis stated: “$ETH seems to be forming head and shoulder pattern. If Ethereum loses the $2,040 level, expect a massive dump.”
Spot ETF Outflows Create Headwinds
Ethereum spot exchange-traded funds registered $59.94 million in net outflows during the March 16–20 trading week, based on SoSoValue information shared by PANews on March 23.
BlackRock’s ETHA dominated outflow activity with $69.59 million departing the product throughout the week. Despite this, ETHA maintains $11.91 billion in cumulative historical net inflows.
Fidelity’s FETH experienced $61.62 million in redemptions during this timeframe. The fund’s aggregate historical net inflow remains at $2.32 billion.
Grayscale Ethereum Mini Trust (ETH) stood as the sole product attracting capital last week, collecting $6.87 million in net inflows. This vehicle has accumulated $1.85 billion in total historical net inflows.
Current data through March 23 shows combined Ethereum spot ETF net assets at $12.33 billion, comprising 4.79% of Ethereum’s overall market capitalization. The cumulative historical net inflow across the entire Ethereum ETF ecosystem reaches $11.73 billion.
Get 3 Free Stock Ebooks
Discover top-performing stocks in AI, Crypto, and Technology with expert analysis.
- Top 10 AI Stocks - Leading AI companies
- Top 10 Crypto Stocks - Blockchain leaders
- Top 10 Tech Stocks - Tech giants


