
 Price Analysis: Critical Support Zones After Nearly 8% Decline")
TLDR
- Jeffrey Wilcke, an Ethereum co-founder, moved 79,176 ETH (approximately $157M) to Kraken, triggering market concern
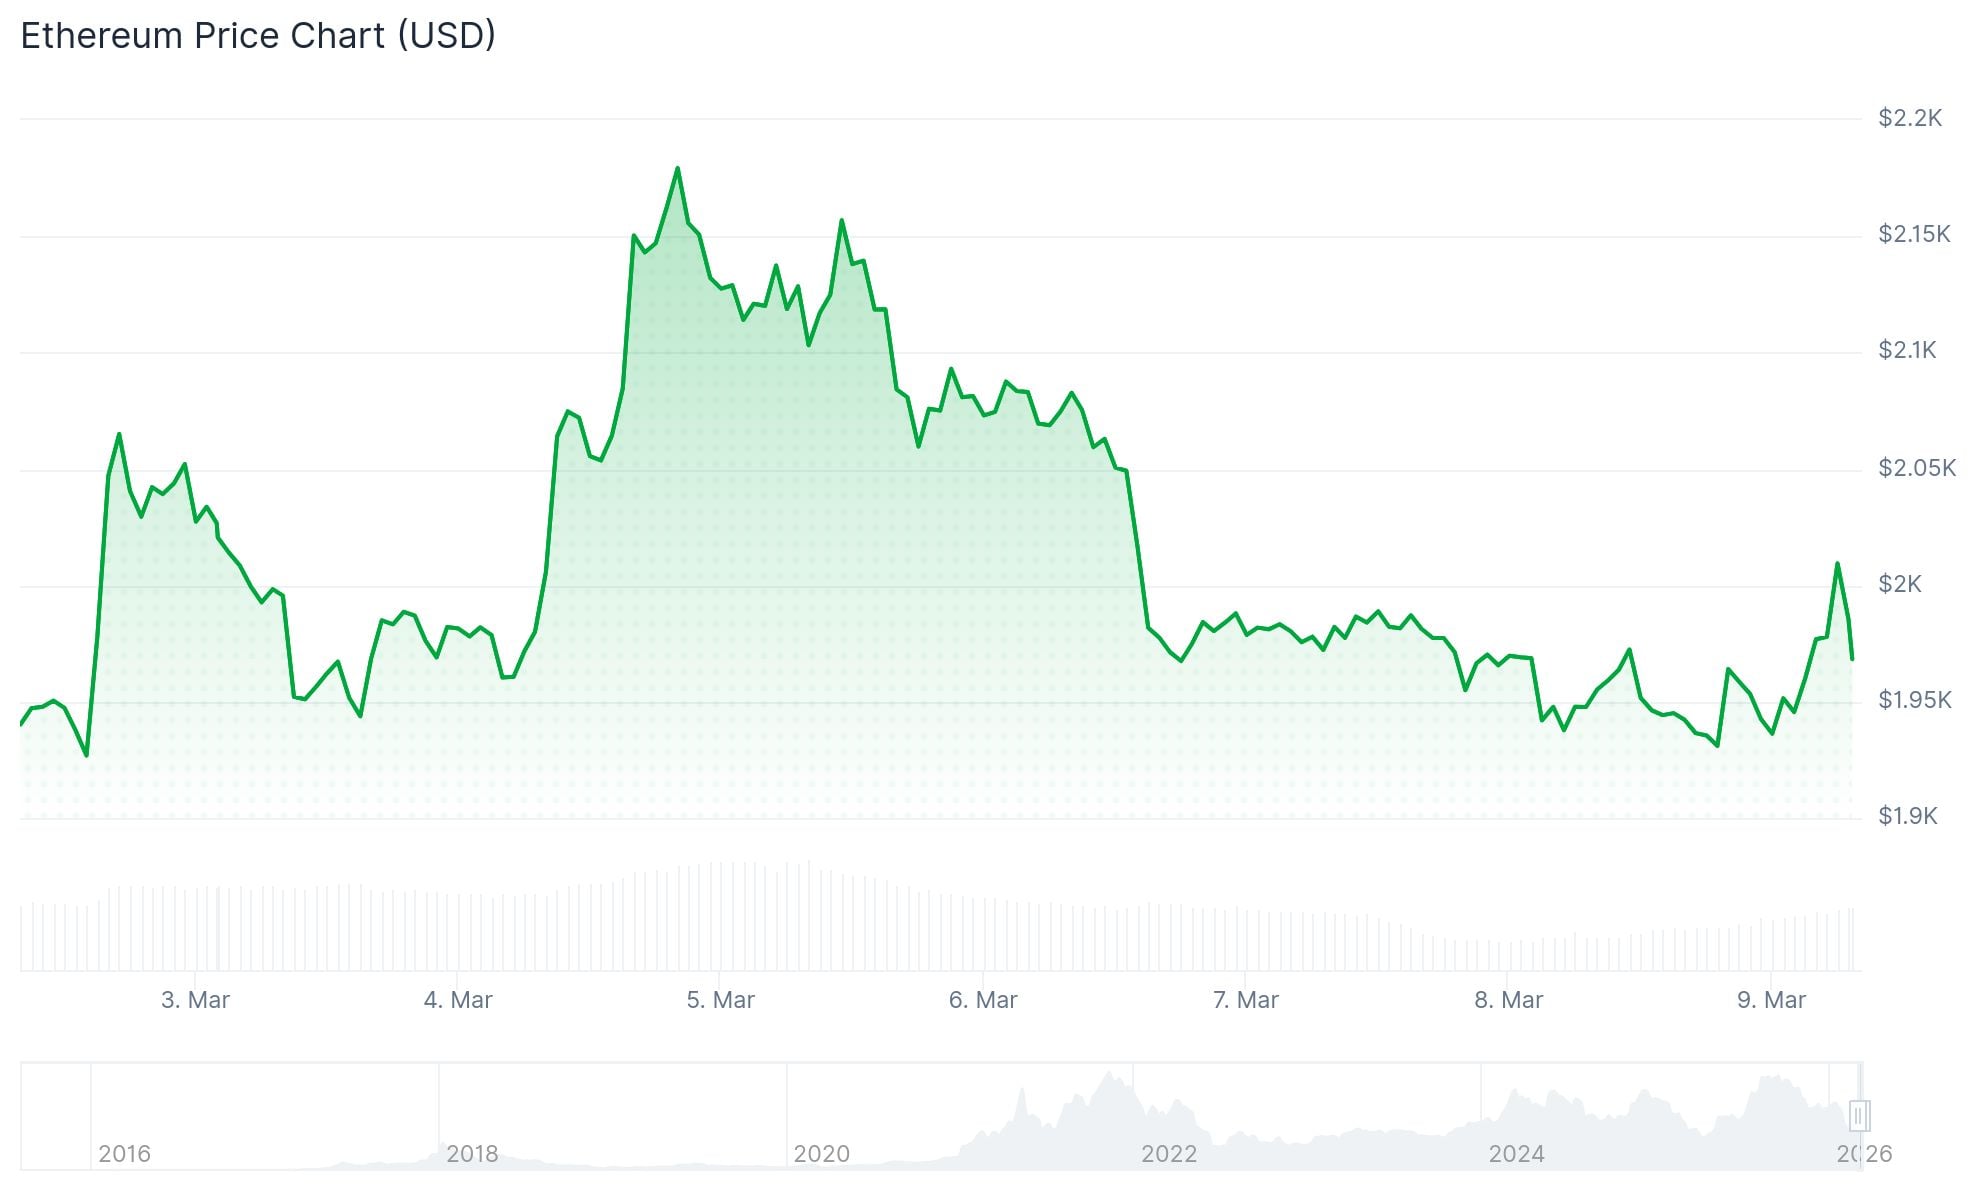
- Since March 6, ETH has declined close to 8%, bottoming at $1,912
- Current trading remains under the $2,000 mark and below the 100-hourly Simple Moving Average
- Certain whale groups (holding 100K–10M ETH) continue accumulating amid broader market anxiety
- Critical support zone lies between $1,900–$1,920; failure here could push toward $1,800
Since March 6, Ethereum has experienced sustained selling pressure, declining nearly 8% and testing crucial support near the $1,900 threshold. Market participants grew nervous after Jeffrey Wilcke, one of Ethereum’s original co-founders, deposited 79,176 ETH—valued at roughly $157 million—into Kraken exchange.
Within cryptocurrency trading circles, substantial deposits to centralized exchanges typically signal potential selling intentions. This transaction unsettled market sentiment and contributed additional downward momentum to an already fragile technical setup.
ETH briefly touched $1,912 before finding temporary footing. Currently, as of March 9, the asset trades near $1,980, positioned below the 100-hourly Simple Moving Average, maintaining bearish short-term momentum.
Large Holders Provide Counterbalance Through Accumulation
Between March 2 and March 6, Bitcoin spot exchange-traded funds attracted $568 million in net inflows. During this identical timeframe, Ethereum spot ETFs registered $23.56 million in net purchases, demonstrating persistent institutional demand despite ETH’s recent price deterioration.
Contrary to the panic surrounding Wilcke’s exchange deposit, analysis of wallet cohorts reveals that not all significant holders are liquidating. Addresses containing between 100,000 and 10 million ETH have been actively purchasing during this price decline.

This accumulation from substantial investors has provided crucial buying support, preventing a more severe breakdown. The current market dynamic reflects tension between selling pressure from the co-founder’s movement and strategic buying from other major participants.
For now, the $1,920 price level has functioned as immediate support. Should buyers successfully defend this zone, ETH could stage a recovery attempt toward $1,980, followed by the psychological $2,000 barrier.
Overhead resistance presents significant challenges. The first meaningful obstacle appears at $2,020, with $2,050 following closely behind—this level coincides with the 50% Fibonacci retracement measured from the recent move down from $2,200 to $1,912.
Technical Framework Shows Bearish Configuration
The broader technical landscape remains decidedly bearish. Virtually all major moving averages sit well above current price action. The 200-period EMA stands at $2,899, while the 200-period SMA rests at $3,324—both substantially distant from current levels.
Near-term momentum indicators show more balanced readings. The RSI registers 42.4, the Stochastic oscillator positions at 40.4, and the CCI measures −47.7. The ADX indicator reads 29.9, indicating trend presence without reaching extreme conditions.
Should the $1,920 support fail, attention shifts to approximately $1,880 as the subsequent defense level. Below that threshold, the $1,800 area emerges as a significant target—a price zone where buyers have demonstrated historical willingness to engage.
As of March 9, 2026, ETH changed hands around $1,939, continuing to struggle beneath the $2,000 level that has proven resistant to recapture attempts.
Get 3 Free Stock Ebooks
Discover top-performing stocks in AI, Crypto, and Technology with expert analysis.
- Top 10 AI Stocks - Leading AI companies
- Top 10 Crypto Stocks - Blockchain leaders
- Top 10 Tech Stocks - Tech giants


