
 Price Alert: Analyst Cautions Critical $2,100 Support Level at Risk")
Key Takeaways
- ETH currently sits around $2,130, representing a ~12% decline from its recent peak of $2,420
- Potential US-Iran ceasefire negotiations may provide relief if crude oil prices decline
- Ethereum spot ETFs experienced $33M in net withdrawals on May 21
- Approximately $1.7B in leveraged long positions risk liquidation should ETH fall beneath $2,044
- Critical support zone identified at $2,080 — breaching this level could trigger a move toward $1,800
Ethereum continues to maintain its position marginally above the $2,100 threshold while market participants monitor multiple risk factors that could catalyze a substantial downward price movement.
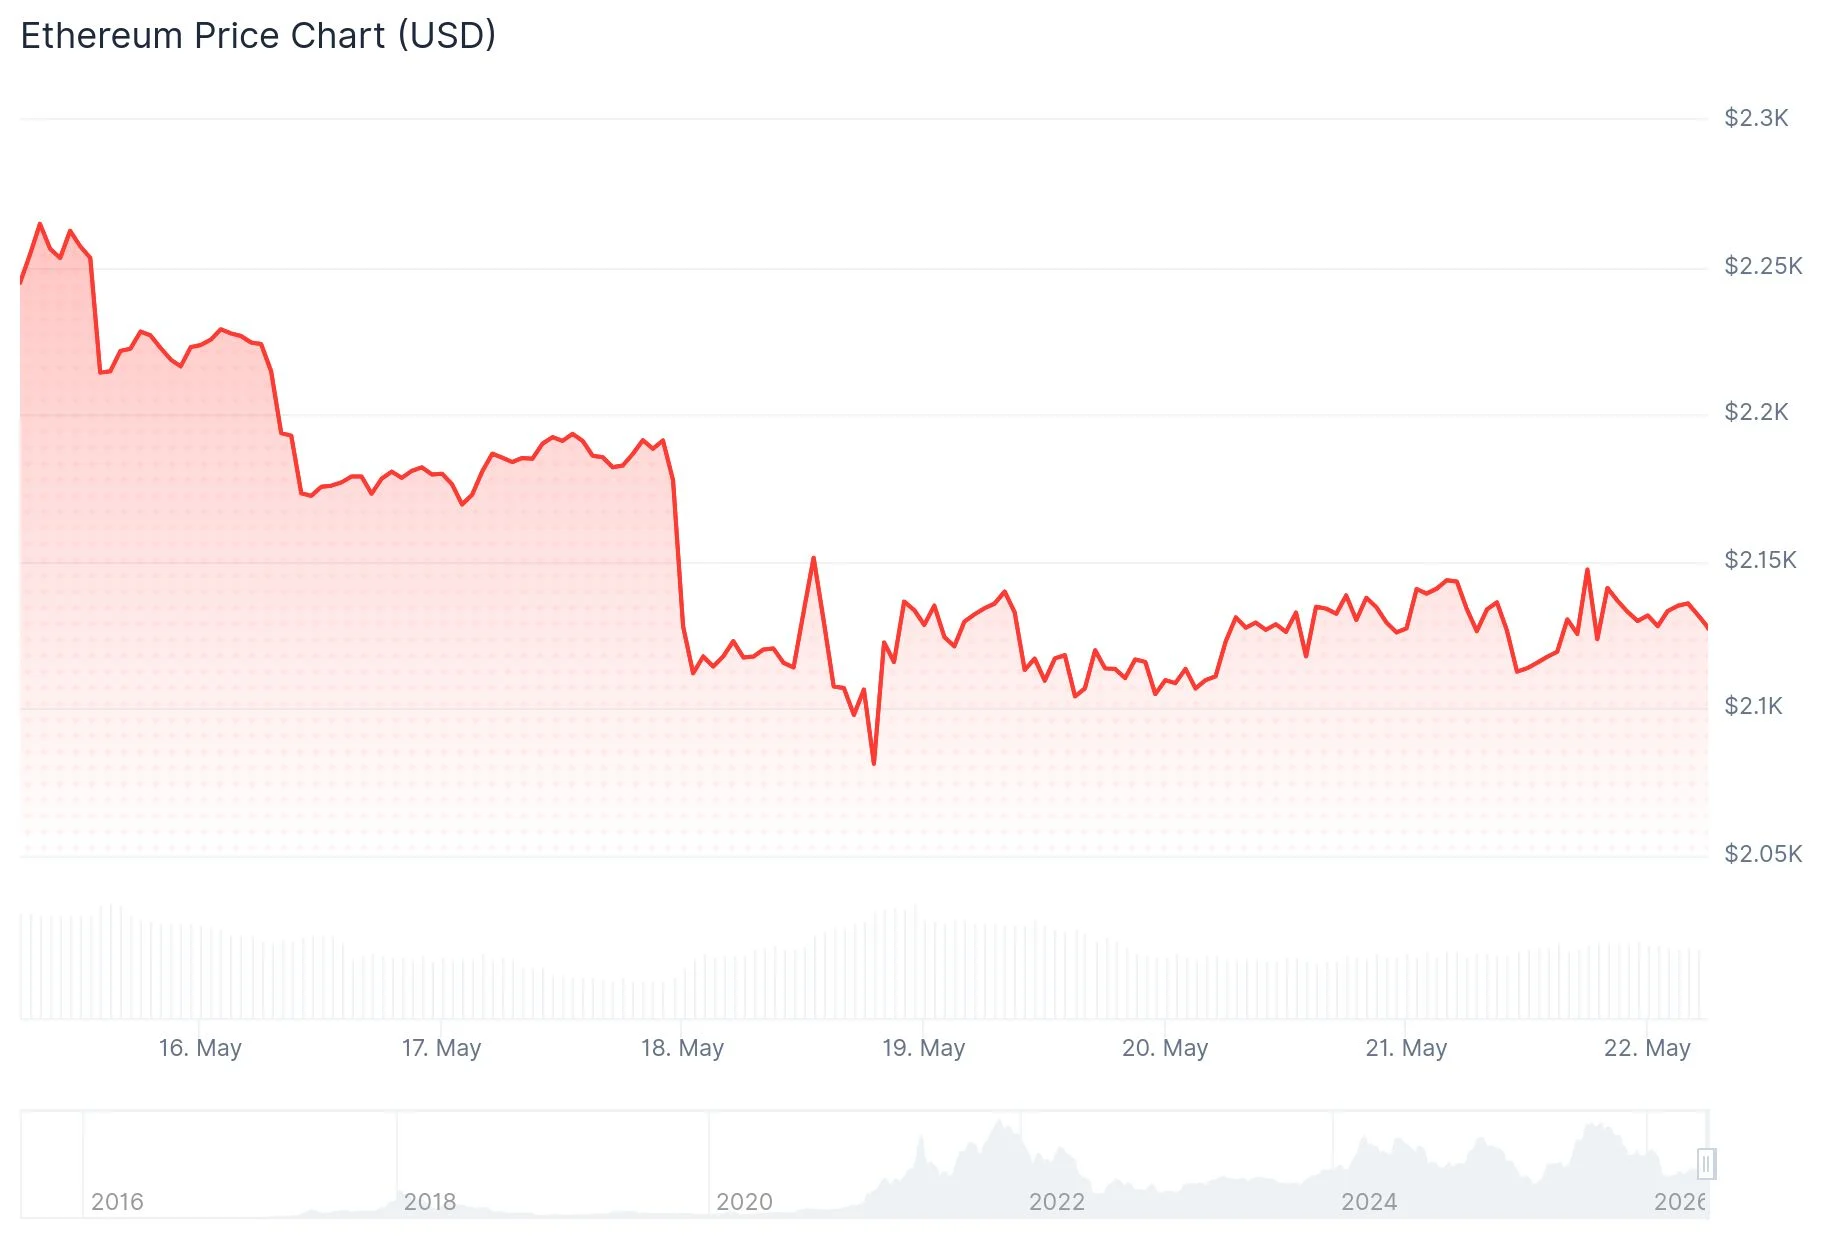
ETH was trading around $2,129 on Wednesday, marking approximately a 12% retreat from its recent local peak of roughly $2,420. This decline coincided with US Treasury yields surging to 4.58%, representing their highest point in several months after inflation figures exceeded market expectations. Elevated yields typically attract capital toward traditional safe-haven assets, diverting it away from cryptocurrency markets.
Spot Ethereum exchange-traded funds contributed additional downward pressure. ETH ETFs registered $33M in net outflows on May 21, extending a pattern of continuous redemption activity. Bitcoin ETFs similarly experienced $101M in withdrawals during the same period, while Solana ETFs stood as the lone exception with $4M in positive flows.
BitMEX co-founder Arthur Hayes identified an underlying structural issue. “Ethereum ETFs continue to lack the structural yield benefits that numerous institutions anticipated,” Hayes noted. “Without staking capabilities embedded within these investment vehicles, capital distribution will persistently favor Bitcoin.”
Geopolitical Developments and Energy Market Dynamics
Reports surfaced Thursday indicating the US and Iran are approaching a ceasefire agreement, with Pakistan serving as intermediary. The proposed deal allegedly incorporates a collaborative monitoring framework in the Strait of Hormuz. In response to this development, US crude oil prices retreated from levels above $100 toward $96.

BitMine Immersion Chairman Thomas Lee commented on X that resolving this geopolitical tension could have a “decisive” effect on oil markets — and consequently, Ethereum. “Elevated oil prices increase the likelihood of Federal Reserve rate hikes,” Lee explained. “Given that ETH and cryptocurrency valuations are tied to monetary liquidity conditions, crypto assets will demonstrate inverse correlation with oil prices.”
Lee’s organization, BitMine, maintains the largest corporate Ethereum holdings, possessing approximately 5.278 million ETH.
Analyst Ted Pillows adopted a more cautious stance, sharing on X: “The outlook isn’t favorable for $ETH. Ethereum must maintain support above $2,100, otherwise we could see significant deterioration.” His assessment echoes widespread apprehension among market participants that the $2,100 region represents a crucial threshold.
Technical Indicators Signal Weakness
Examining the daily timeframe, Ethereum has violated an ascending channel formation and currently trades beneath its 20-, 50-, and 100-day exponential moving averages, which congregate between $2,225 and $2,326. The MACD indicator has crossed into negative territory, validating bearish momentum.
Blockchain analytics reinforce these concerns. Wallet addresses containing more than 10,000 ETH have declined to their lowest count in nearly ten months. Additionally, net ETH deposits to centralized exchanges have reached their highest level since early 2025 — suggesting increased selling pressure from existing holders.
CoinGlass tracking reveals over $1.7B in leveraged long positions clustered between $2,044 and $2,000. A price movement below this range could initiate a domino effect of forced liquidations. ETH recorded $47.9M in total liquidations across both directions within just the past 24 hours.
Subsequent critical support zones are identified at $2,080, with secondary levels at $1,909 and $1,800.
Get 3 Free Stock Ebooks
Discover top-performing stocks in AI, Crypto, and Technology with expert analysis.
- Top 10 AI Stocks - Leading AI companies
- Top 10 Crypto Stocks - Blockchain leaders
- Top 10 Tech Stocks - Tech giants


