



TLDR
- Ethereum is currently priced at $2,100, showing a 1.34% increase over 24 hours while experiencing a 3.72% decline across the past seven days
- The digital asset rebounded from $2,000 support zone but encountered rejection at $2,150 resistance level
- Technical indicators show RSI reading 37.56 and MACD at -52.1, indicating continued bearish momentum
- Successfully clearing $2,150 could propel ETH toward the $2,220–$2,250 price range
- Loss of the $2,065 level may result in a retest of the $2,000 support zone
The second-largest cryptocurrency by market capitalization is hovering near $2,100 following a modest 24-hour uptick of 1.34%. Weekly performance remains negative at -3.72%, with CoinMarketCap reporting a market capitalization of $253.63 billion.
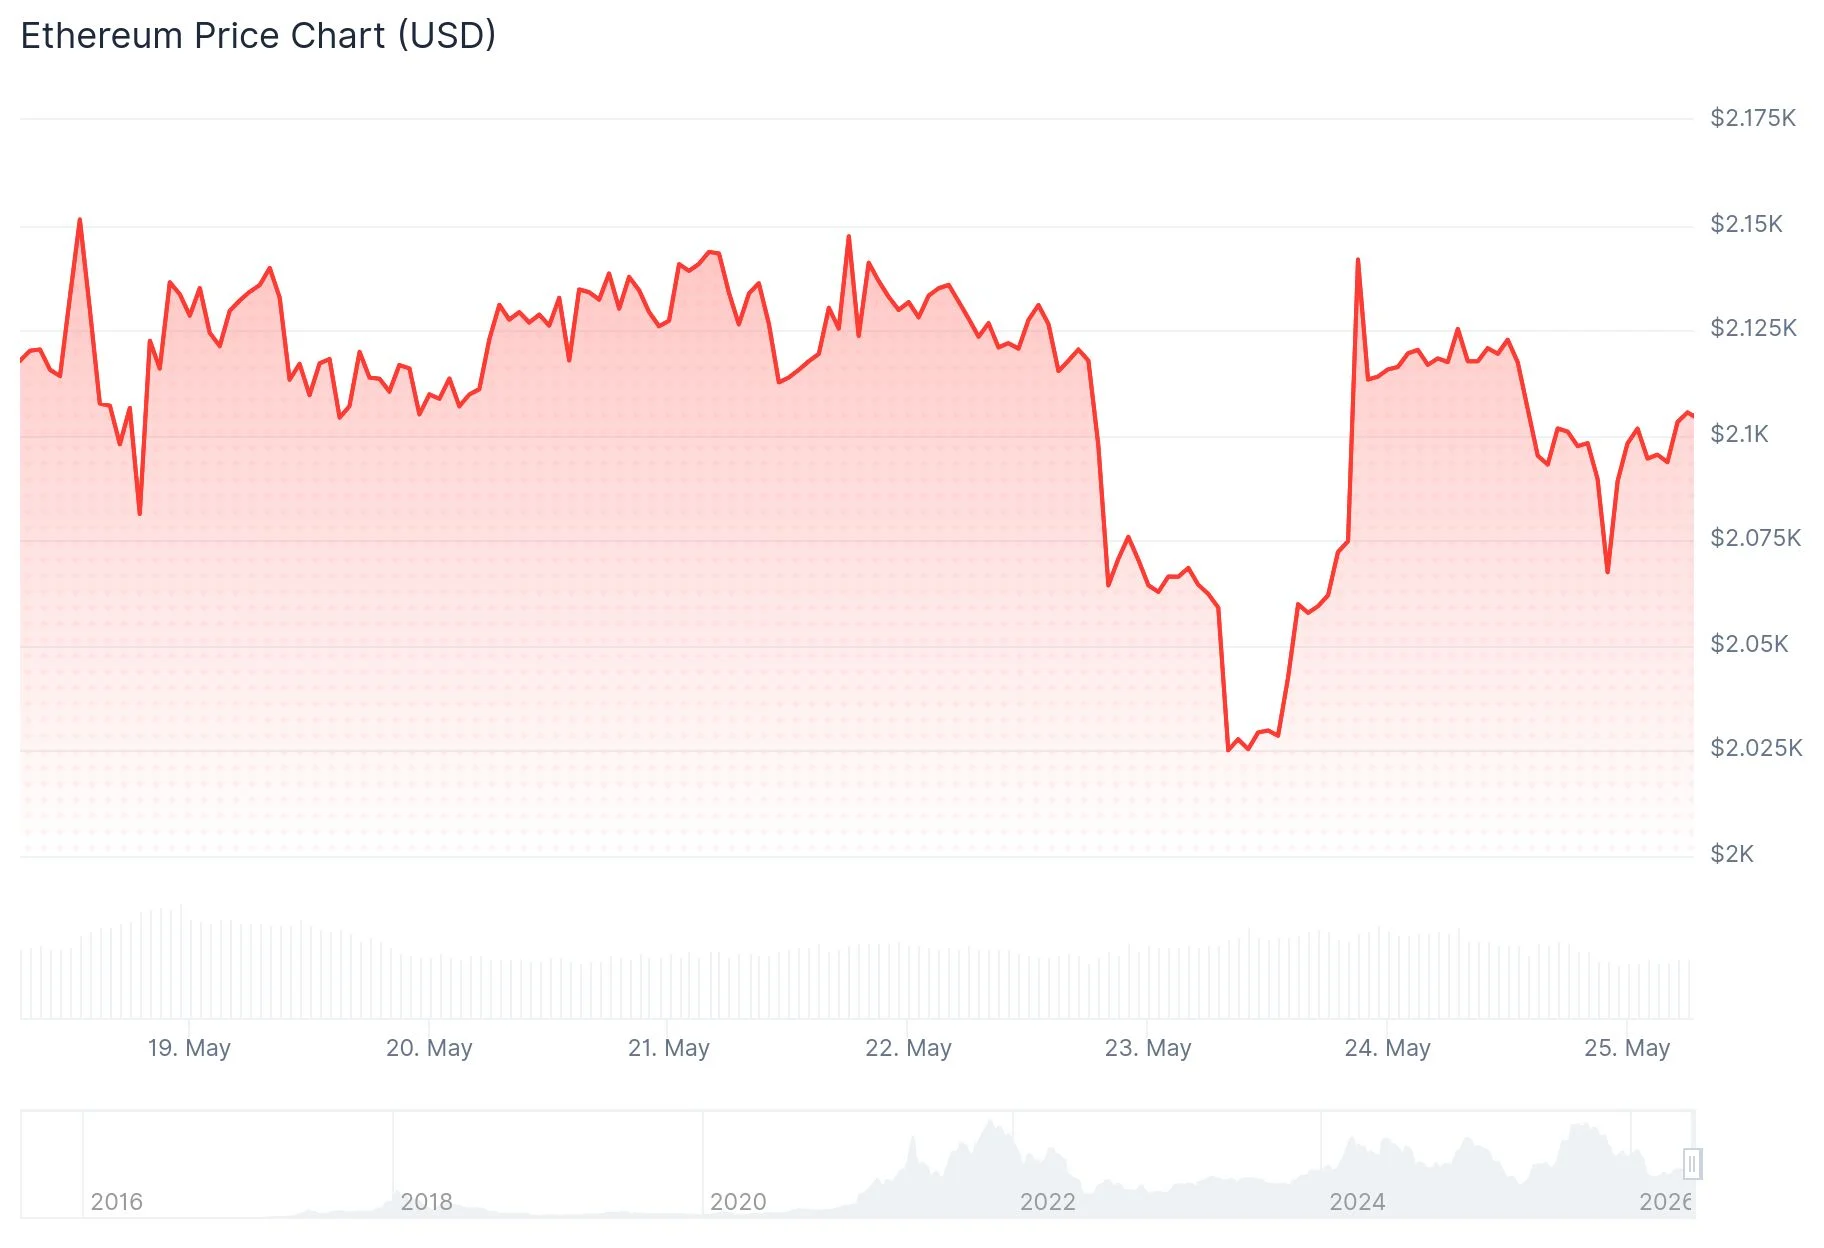
Recent price action saw ETH rebound from the psychologically significant $2,000 support zone, signaling that buyers remain engaged at this critical threshold. Nevertheless, bulls have been unable to overcome the $2,150 barrier in multiple attempts.
Market analyst TedPillows highlighted that while the bounce from $2,000 demonstrates underlying strength, the decisive moment will come when ETH attempts to reclaim $2,150. A successful breach of this level would likely trigger momentum toward $2,250, whereas failure could see prices retreat back to $2,000.
Crypto strategist Patel shared his perspective on X, identifying the $2,000–$1,400 range as a significant accumulation zone, with $4,700 representing the critical breakout threshold. His analysis projects potential long-term targets at $10K, $15K, and eventually $20K. Patel emphasized: “The Smart Money Doesn’t Chase Green Candles. They Buy The Boring Range Nobody Talks About.” His assessment suggests the current price action may represent an optimal long-term entry opportunity.
Another market observer, The Boss, emphasized that Ethereum’s multi-year ascending trendline established in 2022 remains unviolated. The recent bounce from this trendline zone reinforces its significance as a structural support level. He cautioned that maintaining position above this ascending support is essential for preserving the broader bullish framework.

Technical Indicators Reflect Continued Selling Pressure
The Relative Strength Index currently registers 37.56, positioned below the neutral 50 threshold, while the RSI moving average stands at 40.10. These readings indicate persistent seller dominance, though the asset has yet to reach oversold conditions.
The MACD configuration shows the main line at -52.1, the signal line at -35.9, and a histogram value of -16.2. This technical setup confirms ongoing bearish momentum in the market.
Examining the hourly timeframe reveals a developing bearish trendline with resistance positioned near $2,110. ETH maintains its position above the 100-hour Simple Moving Average, providing a foundation of short-term support.
Critical Price Zones for Traders
Near-term resistance barriers are positioned at $2,110, $2,140, and $2,150. A convincing break above $2,150 would establish a pathway toward $2,220, subsequently $2,250, and possibly $2,320 in extended moves.
Regarding downside protection, the first support level appears at $2,075, followed by $2,055 — representing the 61.8% Fibonacci retracement level measured from the $2,001 bottom to the $2,147 peak. A violation of $2,055 could accelerate decline toward $2,020 or the round-number $2,000 level. Further downside finds major support at $1,940.
Ethereum maintains trading above both the 100-hour Simple Moving Average and the crucial $2,065 level, which bulls must successfully defend to preserve the recovery trajectory and prevent deeper retracements.
Get 3 Free Stock Ebooks
Discover top-performing stocks in AI, Crypto, and Technology with expert analysis.
- Top 10 AI Stocks - Leading AI companies
- Top 10 Crypto Stocks - Blockchain leaders
- Top 10 Tech Stocks - Tech giants



