
 Consolidates at $2,160 as $385M ETF Inflows Signal Institutional Confidence")
Key Highlights
- Ethereum currently sits at $2,160.46, reflecting a 1.95% daily decline
- Trading above its 50-day moving average at $2,100.87 but significantly under the 200-day MA of $3,204.32
- BlackRock introduced its staked Ethereum ETF (ETHB) in March, enhancing institutional accessibility
- Approximately $385 million entered spot Ethereum ETFs during a six-day March run
- Open interest jumped approximately 8–9% within 24 hours, surpassing $30 billion
Ethereum is currently changing hands at $2,160.46, marking a $43.01 decline from the previous session—a 1.95% downtick. Trading opened at $2,203.46, with the daily price range spanning from $2,143.22 on the low end to $2,233.69 at the peak.
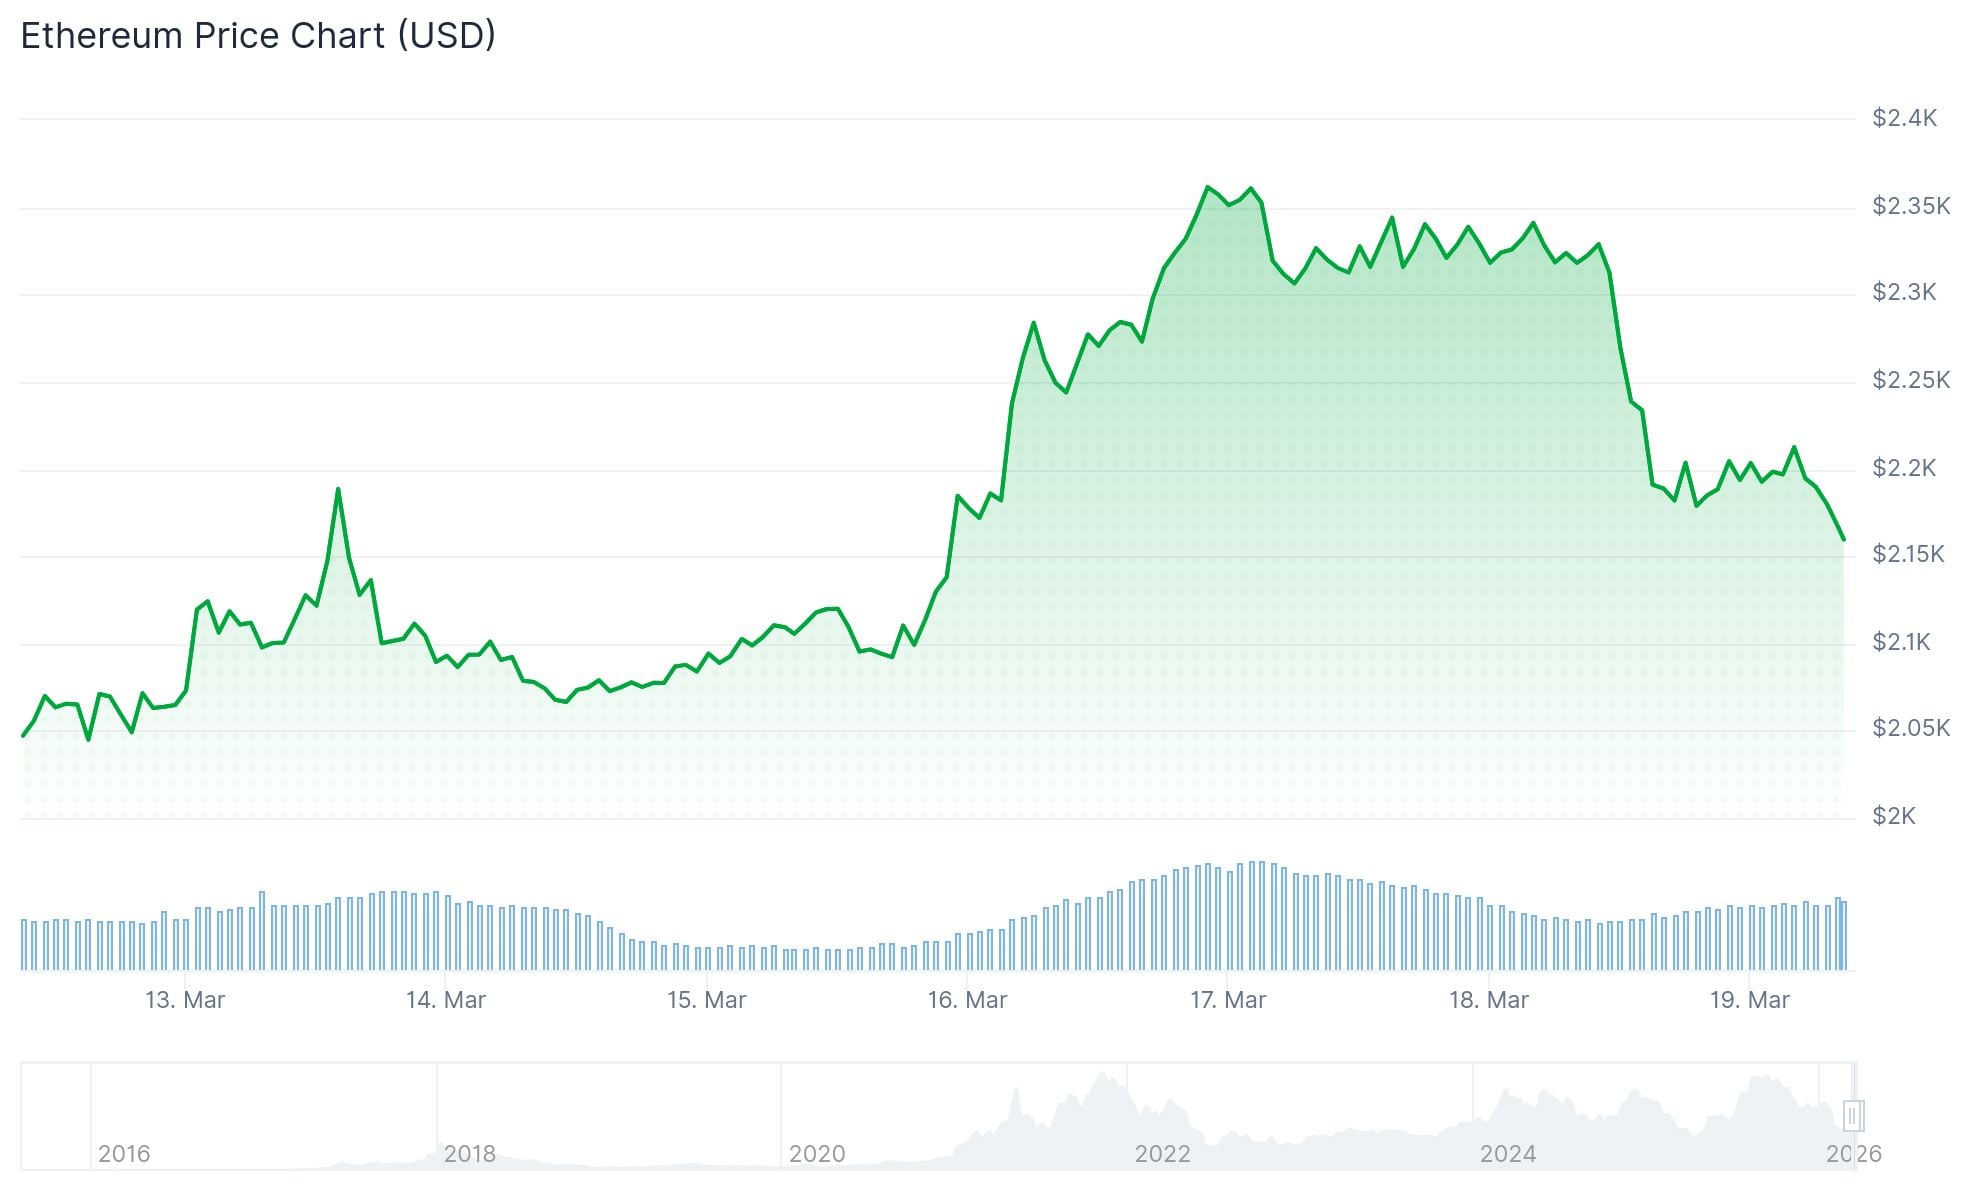
This retreat comes on the heels of a weeks-long advance from the $2,000 territory. Despite today’s softness, ETH remains approximately 8–10% higher than where it stood at the beginning of the month. Trading activity has been subdued at roughly 71 million dollars compared to the typical average of 343 million dollars, suggesting routine profit-taking behavior rather than widespread liquidation pressure.
Growing Institutional Participation Through ETF Vehicles
A significant catalyst this month has been the debut of BlackRock’s iShares Staked Ethereum Trust (ETHB) on the Nasdaq exchange. What sets this product apart from existing spot Ethereum offerings is its incorporation of staking rewards directly into the fund structure, creating a more compelling proposition for institutions seeking exposure to both ETH appreciation and staking income.
Spot Ethereum exchange-traded funds have witnessed consistent capital inflows. During one notable session, approximately 12.6 million dollars entered these products net, with a single fund attracting over 10 million dollars. Throughout a six-day window in March, aggregate inflows into ETH investment vehicles reached approximately 385 million dollars.
This institutional capital has provided a stabilizing force during episodes of speculative profit-taking.

Chart Analysis and Price Structure
Looking at the daily timeframe, Ethereum maintains its position above the 50-day moving average at $2,100.87. This technical level has functioned as a reliable support zone during recent retracements.
However, the 200-day moving average remains distant at $3,204.32, well above current trading levels, indicating that the extended-term trend has yet to fully reverse course.
Critical support zones are identified at $2,000–$2,060. A break beneath that area would bring $1,800 into focus—a level that has established the lower boundary of the current consolidation pattern. Overhead resistance is concentrated between $2,235–$2,380, with a more significant breakout threshold positioned around $2,500.
Ethereum open interest experienced a sharp increase of roughly 8–9% within a single 24-hour window recently, climbing beyond $30 billion across leading platforms including Binance, Bybit, and OKX. Market observers point out that expanding open interest concurrent with price appreciation can amplify volatility in either direction.
ETH has encountered difficulty maintaining momentum above the $2,300–$2,400 corridor. The present market structure reflects consolidation, characterized by overlapping candlestick formations and compressed realized volatility—conditions that often precede more decisive directional movement.
Ethereum’s total network valuation currently registers at approximately $260.76 billion, maintaining its position as the second-largest cryptocurrency by market capitalization.
Get 3 Free Stock Ebooks
Discover top-performing stocks in AI, Crypto, and Technology with expert analysis.
- Top 10 AI Stocks - Leading AI companies
- Top 10 Crypto Stocks - Blockchain leaders
- Top 10 Tech Stocks - Tech giants


