

TLDR
- ENA forms a double top after failing twice to clear the $0.85 resistance zone.
- Price now retests $0.60–$0.62 support, a crucial demand zone for buyers.
- A daily close below $0.60 could target lower support between $0.46 and $0.51.
- RSI near 44 and a bearish MACD confirm weakening momentum and selling pressure.
Ethena Price is facing increased selling pressure as traders watch a possible double top pattern form on the daily chart. The cryptocurrency is currently trading near $0.67, with a crucial support zone between $0.60 and $0.62 acting as the key level to monitor. Market participants are weighing whether this support can hold or if a deeper pullback toward $0.46–$0.51 might unfold.
ENA Double Top Pattern Signals Market Caution
Ethena Price has twice failed to clear resistance near $0.85, leaving behind a structure often recognized as a double top. This pattern typically indicates that buying momentum is weakening after repeated unsuccessful breakouts. The $0.60–$0.62 area is now critical, serving as a historical demand zone where buyers have previously stepped in.

ENA/USD 1D Chart | Source: X
Traders view a daily close below $0.60 as a potential trigger for extended downside. Such a move could confirm the double top formation and open the path to the $0.46–$0.51 range. That lower zone has provided strong historical support and aligns with the measured move projected by this bearish chart setup.
Indicators Reflect Weakening Momentum
Furthermore, technical indicators provide additional evidence of fading strength. The Relative Strength Index (RSI) is hovering near 44 and trending lower. This reading shows that buyers are losing control but have not yet reached oversold conditions, leaving room for further declines.
The Moving Average Convergence Divergence (MACD) also supports this view. The MACD line remains below the signal line, and red histogram bars are growing. These signals confirm downward momentum and add weight to the expectation of further pressure on Ethena Price if support breaks.

Range Dynamics Show Limited Upside
In addition, the broader trading range reinforces the importance of the $0.60–$0.62 zone. Ethena Price has been moving between strong resistance near $0.88 and the current lower boundary for several weeks. Repeated rejections at the upper edge highlight persistent selling interest from long-term holders or short-term traders.
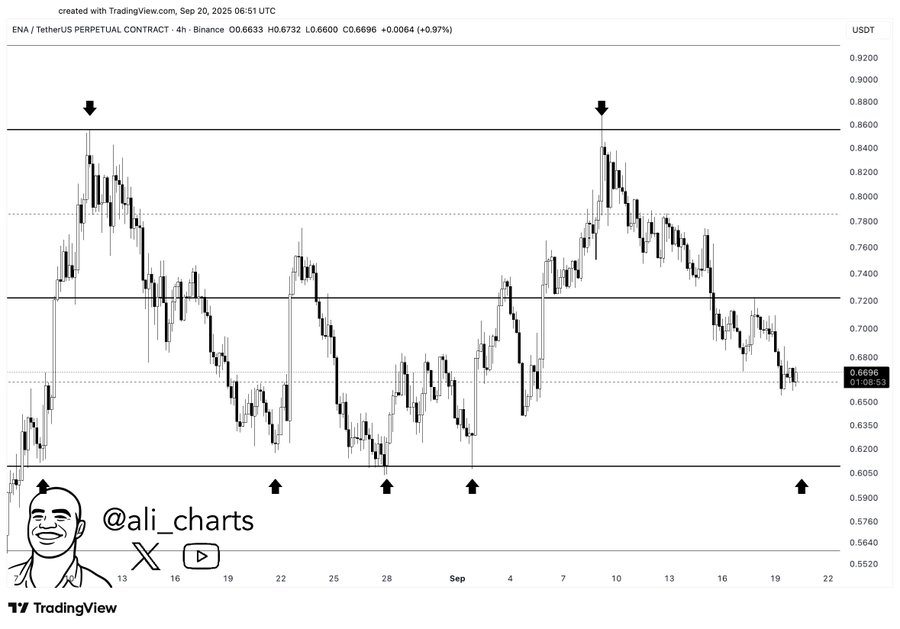
ENA/USD 4H Chart | Source: X
Any rebound from present levels will likely face immediate resistance around $0.70–$0.72. Regaining that pivot is essential for buyers hoping to retest the $0.88 high. Without strong volume and sustained buying, however, upside attempts may stall quickly.
Short-Term Moves May Offer Opportunities
Even so, short-term traders may still find opportunities within these defined levels. A bounce from $0.60 could provide a brief move back toward mid-range resistance, especially if trading volume spikes. Quick reversals are common in markets where key supports are repeatedly tested.
Still, the risk of a decisive breakdown remains. Should Ethena Price close below $0.60 on strong volume, sellers could target the $0.46–$0.51 zone as the next major support. Monitoring volume alongside price action will help traders distinguish between a temporary dip and a deeper trend shift.
Ethena Price sits at a critical inflection point. The double top pattern, weakening momentum signals, and tight trading range all suggest that the $0.60–$0.62 area will determine its next significant move.
Get 3 Free Stock Ebooks
Discover top-performing stocks in AI, Crypto, and Technology with expert analysis.
- Top 10 AI Stocks - Leading AI companies
- Top 10 Crypto Stocks - Blockchain leaders
- Top 10 Tech Stocks - Tech giants


