
 Rockets 53% Higher as Derivatives Interest Surges to New Peak")
Key Highlights
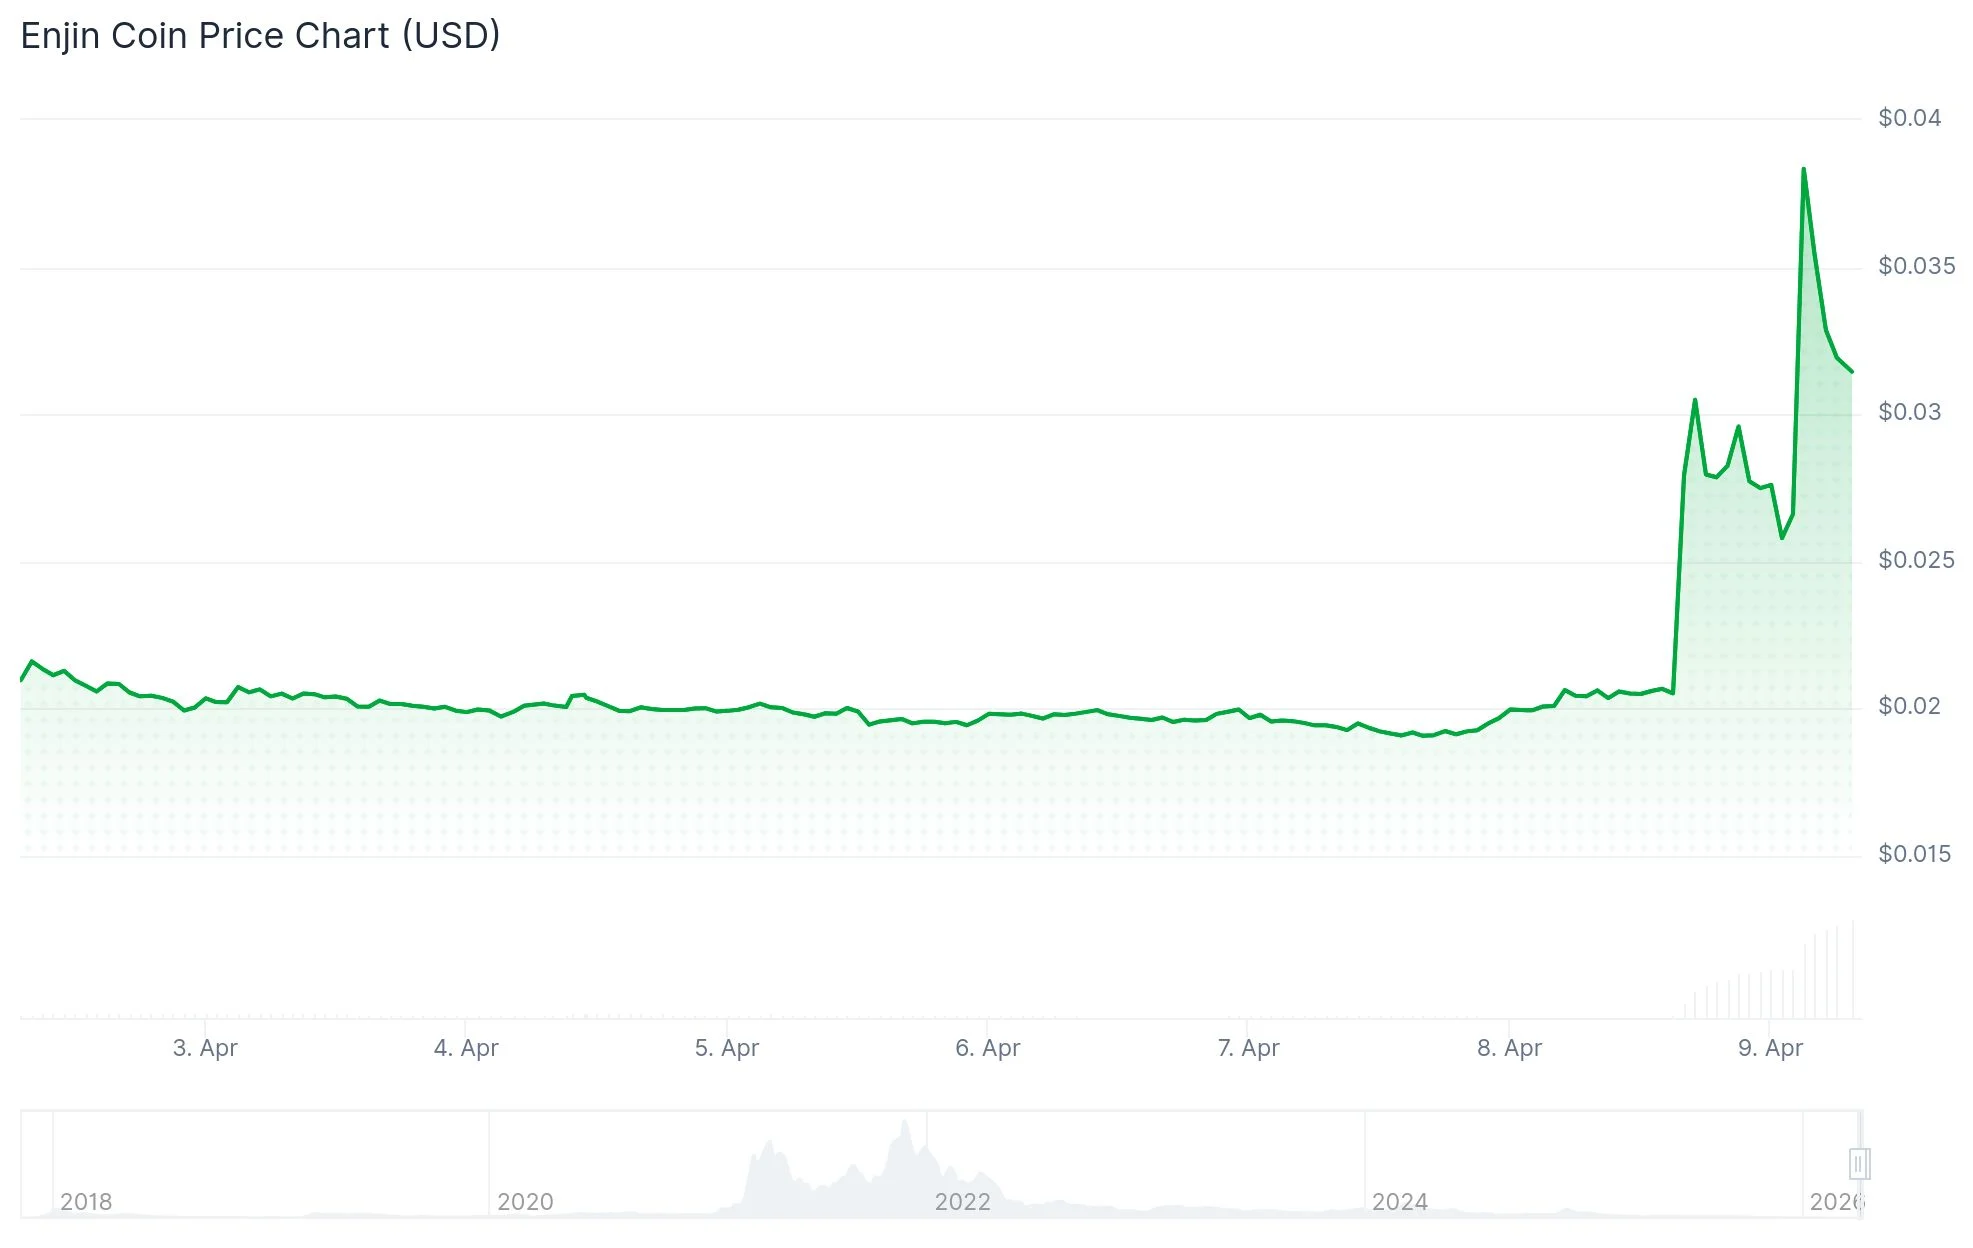
- ENJ rallied more than 53% within 24 hours, reaching price levels between $0.029 and $0.035
- Trading volume spiked to $105–$216 million, dramatically exceeding typical daily activity
- Futures open interest climbed to an unprecedented $74.68 million from $19.82 million just 48 hours earlier
- Price increases were uniform across 56 trading pairs, indicating authentic market demand
- Technical indicators show RSI approaching 82, pointing to overbought territory that may limit further upside
Enjin Coin (ENJ) delivered one of its most dramatic price rallies in months, climbing more than 53% during a single 24-hour period. Token prices ranged from approximately $0.029 to $0.035 across various exchanges and timeframes, with minor discrepancies between different data providers.
What made this surge particularly noteworthy was its timing: ENJ rocketed higher while Bitcoin registered only minor movements. This divergence indicates that token-specific catalysts, rather than broader cryptocurrency market sentiment, fueled the buying pressure.
Volume metrics painted a compelling picture. According to Santiment, ENJ’s ecosystem trading volume reached $216.97 million on Thursday — marking the highest level recorded since April 2025. Meanwhile, MEXC exchange data showed $105.7 million in 24-hour volume against a circulating market capitalization of only $57.8 million.

This translates to a volume-to-market-cap ratio between 1.8x and 2.1x. For context, sustainable markets typically maintain ratios between 0.1x and 0.5x.
Futures Market Shows Explosive Growth
Derivatives data added further weight to the bullish narrative. According to CoinGlass metrics, ENJ futures open interest climbed to $74.68 million on Thursday, representing a substantial increase from the $19.82 million recorded on Tuesday. This surge in open interest typically signals fresh capital flowing into the asset.


The rally demonstrated remarkable consistency across trading venues. Analysis of 56 different currency pairs showed ENJ appreciation ranging from 37.97% to 43.68%, with a standard deviation of merely 1.8 percentage points. Such uniformity across pairs strongly suggests widespread buying interest rather than isolated exchange-specific activity.
Technically, ENJ reclaimed positions above both its short-term and medium-term exponential moving averages. The 200-day EMA positioned near $0.035 represents the immediate overhead resistance level. Daily chart RSI readings approached 82, firmly in overbought territory.
The MACD histogram turned decisively positive, confirming strong near-term bullish momentum. Should ENJ maintain support above the 23.6% Fibonacci retracement at $0.031, potential upside targets include $0.051, $0.066, and $0.082.
Blockchain Metrics and Warning Signals
Blockchain analytics revealed a network growth index reading of 71, representing the highest measurement since August 2025. Large holder activity also intensified, with on-chain wallet interactions increasing in tandem with price appreciation.
Nevertheless, CryptoQuant data highlighted potential warning signs of diminishing buyer momentum. Futures market analysis indicated growing retail participation accompanied by negative sentiment readings, while sell-side pressure became evident in both spot and derivatives markets.
ENJ currently occupies a market cap ranking between #406 and #416, significantly lower than its top-50 position achieved during the 2021 NFT market peak. The current market capitalization of approximately $54–$58 million represents roughly a 94% decline from its all-time high valuation.
The critical price zone to monitor spans $0.033 to $0.038 resistance. A convincing breakout above this range could pave the way for continued appreciation, whereas a retreat below $0.025 support might catalyze a more significant correction.
Get 3 Free Stock Ebooks
Discover top-performing stocks in AI, Crypto, and Technology with expert analysis.
- Top 10 AI Stocks - Leading AI companies
- Top 10 Crypto Stocks - Blockchain leaders
- Top 10 Tech Stocks - Tech giants


