
 Shows Bullish Signs as TD Indicator Flashes Buy Signal — Rally Ahead?")
Key Takeaways
- Despite price consolidation near recent lows, Dogecoin’s net position delta continues climbing, indicating persistent accumulation.
- The percentage of DOGE holders in profit has declined to levels historically linked with bottoming formations.
- Market analyst Ali Charts identified a TD buy signal on DOGE, suggesting a possible trend reversal.
- DOGE’s weekly timeframe reveals a higher lows pattern — a technical structure that preceded significant rallies in the past.
- Historical data shows July has been favorable for DOGE, posting gains in four out of the past six years.
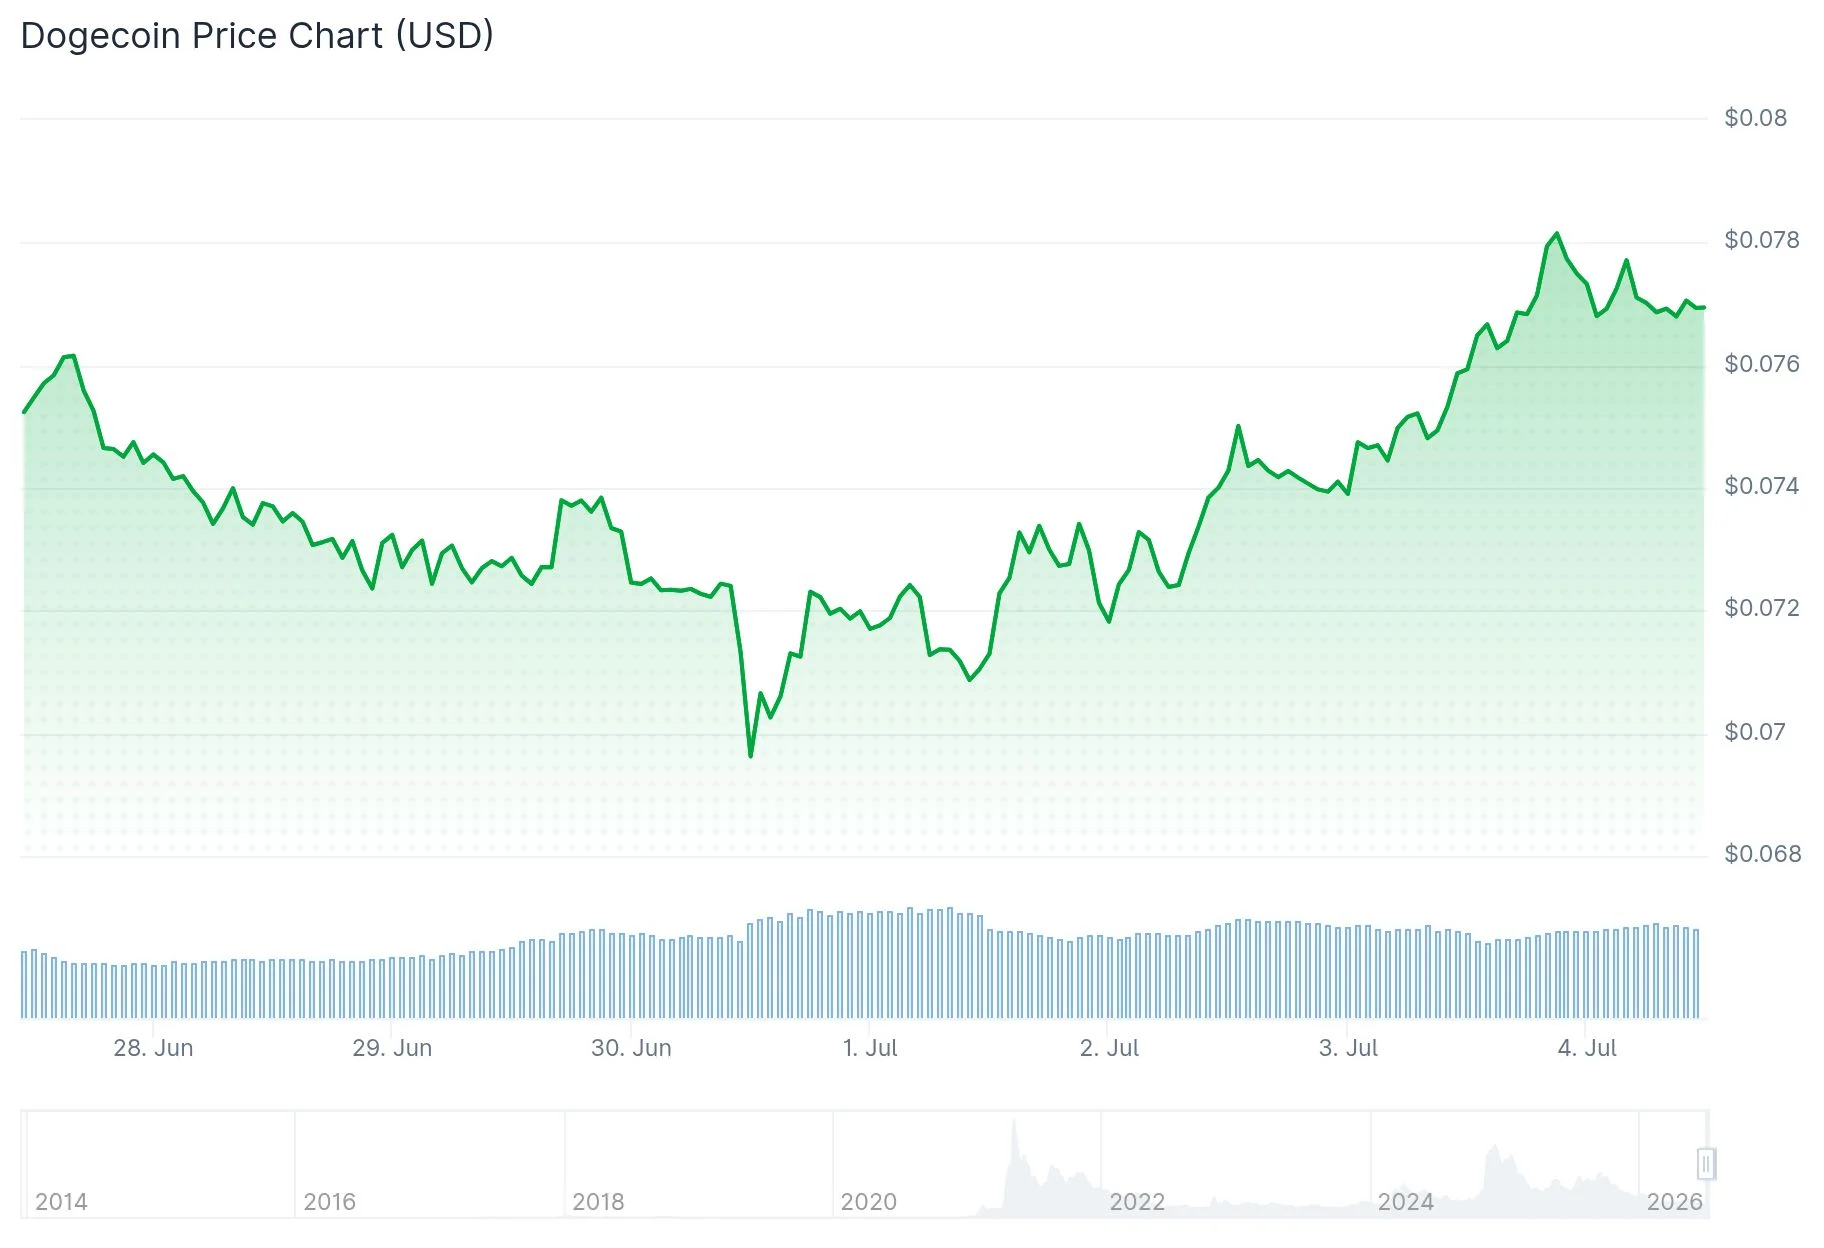
Dogecoin currently trades at approximately $0.07535, reflecting a 1.96% gain over the past day. The meme coin maintains a market capitalization hovering around $12.85 billion, while 24-hour trading volume registers near $697 million. Multiple technical and on-chain indicators are capturing trader interest.
Analyst CW highlighted that Dogecoin’s net position delta has maintained an upward trajectory despite recent price weakness. This metric measures the equilibrium between buy-side and sell-side activity. When the delta rises during price declines, it typically indicates investors are increasing their holdings rather than liquidating.
According to CW, this accumulation pressure has been developing over an extended period. The analyst suggested that sustained demand at these levels could fuel a more substantial upward movement if the trend persists.
Meanwhile, analyst Cryptollica presented data revealing that the portion of DOGE supply currently in profit has fallen into what they described as a “deep bottom zone.” This indicates that a smaller proportion of holders are experiencing gains at present price levels, with many earlier buyers now underwater.
Cryptollica explained that this configuration typically emerges following prolonged distribution phases, after short-term speculators have exited their positions. Some market participants view this condition as evidence that selling exhaustion may be approaching.

Technical Indicator Points to Reversal Opportunity
Market analyst Ali Charts shared on X that Dogecoin has generated a TD buy signal, commenting: “Things are about to go wild.” TD buy signals represent a technical tool that certain traders employ to identify potential reversal points following downward trends.
This indicator contributes to an emerging narrative of shifting near-term momentum favoring DOGE bulls.
Examining the 30-minute timeframe, DOGE bounced from the $0.070 support level accompanied by elevated volume. Subsequently, the asset has established a sequence of higher lows and higher highs, indicating short-term bullish control. The $0.075 level represents the immediate resistance zone under observation.
Long-Term Chart Structure Mirrors Previous Bull Phases
Market observer Javon Marks drew attention to Dogecoin’s weekly chart, emphasizing the formation of ascending lows — a configuration that materialized before earlier significant expansion cycles. Marks stated the current setup appears recognizable and that this pattern has historically preceded substantial price advances.
The ascending support trendline beneath DOGE’s extended timeframe structure remains unbroken. This preservation maintains the broader bullish thesis, although definitive confirmation would necessitate a decisive breach of overhead resistance.
July’s historical performance is also drawing attention from market participants. DOGE recorded a 27.1% gain in July 2025, rose 17% in July 2023, and has posted a 4.27% increase in July 2026 thus far. The asset declined during July 2024 and July 2021.
At present price levels, DOGE maintains a circulating supply of 170.62 billion tokens with no hard supply ceiling in place.
Get 3 Free Stock Ebooks
Discover top-performing stocks in AI, Crypto, and Technology with expert analysis.
- Top 10 AI Stocks - Leading AI companies
- Top 10 Crypto Stocks - Blockchain leaders
- Top 10 Tech Stocks - Tech giants


