
 Rally Under Scrutiny: Analysts Question Sustainability of Recent Gains")
Key Takeaways
- Dogecoin hovers around $0.09, locked in a narrow consolidation pattern without definitive directional momentum.
- Technical indicators show RSI at 46.30 with flat MACD, reflecting equilibrium between buying and selling pressure.
- DOGE rallied 4.5% approaching $0.10, outshining both Bitcoin and Ethereum during the trading session.
- Market analysis suggests the surge stems from derivative markets and leveraged trades rather than genuine network adoption.
- Technical analyst Ali Charts identified a false breakout pattern on the 12-hour timeframe, projecting potential decline to $0.088.
Dogecoin currently exchanges hands near $0.09 following a notable 4.5% increase that temporarily elevated the price toward the $0.10 psychological barrier. This upward movement enabled DOGE to surpass the performance of both Bitcoin and Ethereum as market participants shifted capital into speculative crypto assets.
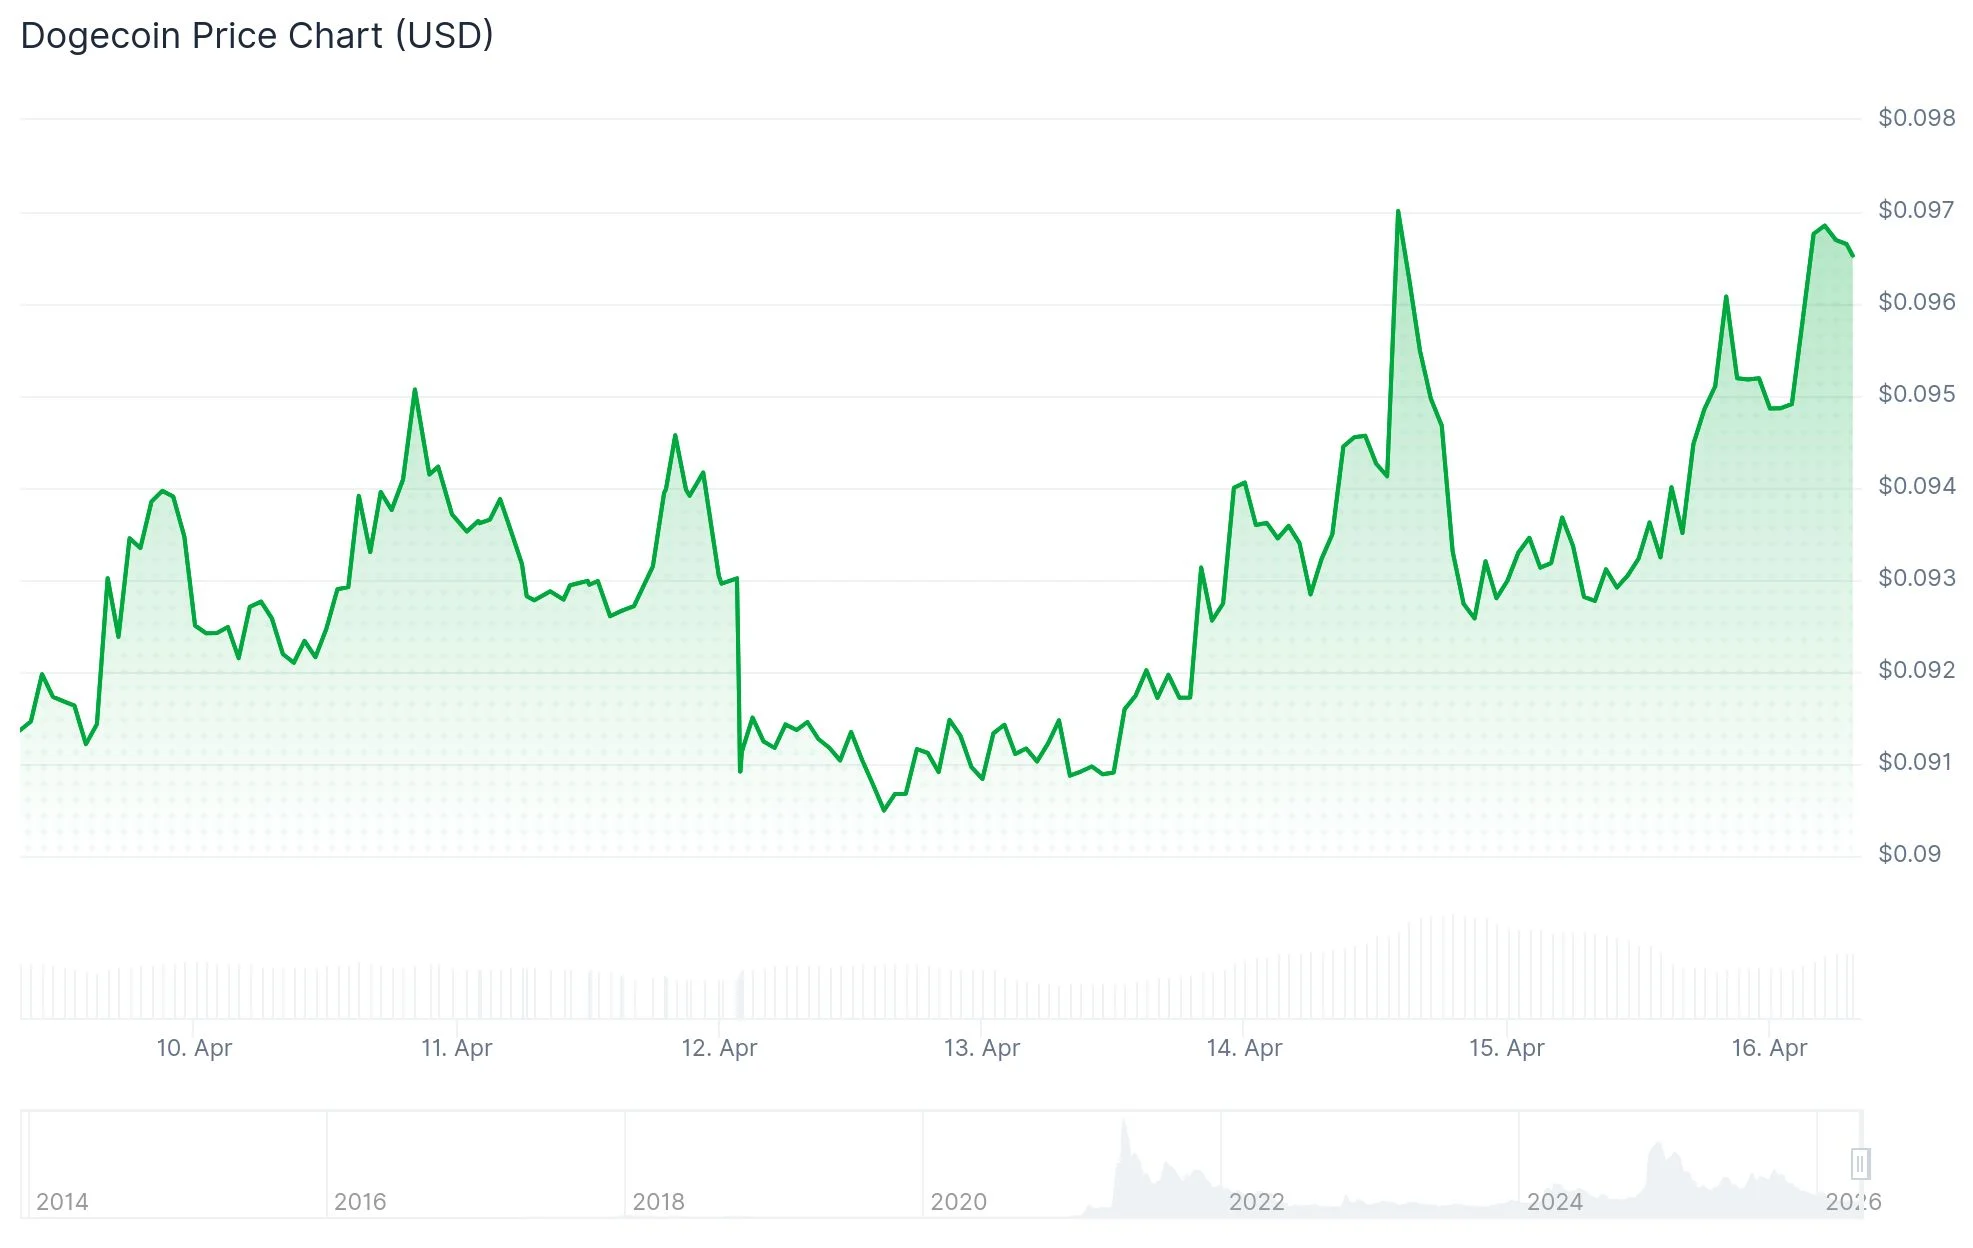
The upward price action carried DOGE from $0.093 to $0.098, successfully piercing the $0.095 resistance barrier amid elevated trading volume. The price trajectory developed through consecutive higher lows before gaining momentum during the closing trading hour.
However, blockchain metrics tell a different story. Network activity measured by daily active addresses shows declining trends, indicating the price movement may be fueled primarily by derivative instruments and leveraged positions rather than fundamental network utilization.
Trading session analysis reveals concentrated buying pressure during late hours, particularly during the advance through $0.097. Volume data validates genuine market participation, distinguishing it from shallow liquidity-driven movements.
Technical Analyst Identifies False Breakout Pattern
Renowned crypto technical analyst Ali Charts highlighted a textbook fakeout formation appearing on the 12-hour chart. DOGE initially appeared to break free from a descending triangle formation, but the downward-sloping trendline proved resilient as resistance, promptly reversing the breakout attempt.

According to Ali Charts, failed breakout attempts of this magnitude typically trigger market searches for liquidity near the formation’s lower boundary. The analyst specifically identified $0.088 as the probable retest destination, describing it as the “definitive line in the sand” for this price structure.
The Relative Strength Index registers at 46.30, demonstrating equilibrium between bullish and bearish forces. Meanwhile, the MACD histogram displays minimal movement, indicating bearish momentum has decelerated without transitioning to bullish territory.
Critical Price Levels Under Watch
Bollinger Band analysis reveals DOGE positioned nearer to the lower band boundary around $0.09, while the upper band near $0.10 maintains its role as price ceiling.
Several short-term and intermediate moving averages converge around the $0.09 level, solidifying its significance as a support foundation. DOGE continues trading substantially beneath its long-term moving average near $0.14, underscoring the prevailing bearish framework.
Market observers are monitoring $0.096 as immediate-term support. Defending this threshold preserves the viability of the current breakout scenario.
The $0.104 level represents critical overhead resistance. A decisive close above this mark would transform the technical structure toward a more constructive bullish outlook. Conversely, a retreat beneath the $0.092–$0.090 zone would likely trigger deeper corrective pressure.
The overarching technical structure remains characterized by compression beneath descending resistance lines rather than representing a confirmed trend reversal pattern.
Get 3 Free Stock Ebooks
Discover top-performing stocks in AI, Crypto, and Technology with expert analysis.
- Top 10 AI Stocks - Leading AI companies
- Top 10 Crypto Stocks - Blockchain leaders
- Top 10 Tech Stocks - Tech giants


