
 Price: Multi-Year Pattern Signals Potential 350% Breakout Rally")
Key Takeaways
- Dogecoin currently consolidates around $0.094, trapped within a descending triangle formation dating back to 2021
- Critical resistance zone located at $0.10; successful breach may unlock price targets between $0.20 and $0.30
- Elliott Wave framework indicates DOGE might be finishing its final corrective wave around $0.093–$0.094
- Technical analyst Javon Marks highlights hidden bullish divergence pattern with potential upside to $0.44
- Blockchain metrics reveal consistent network participation with 60,000–110,000 daily active addresses
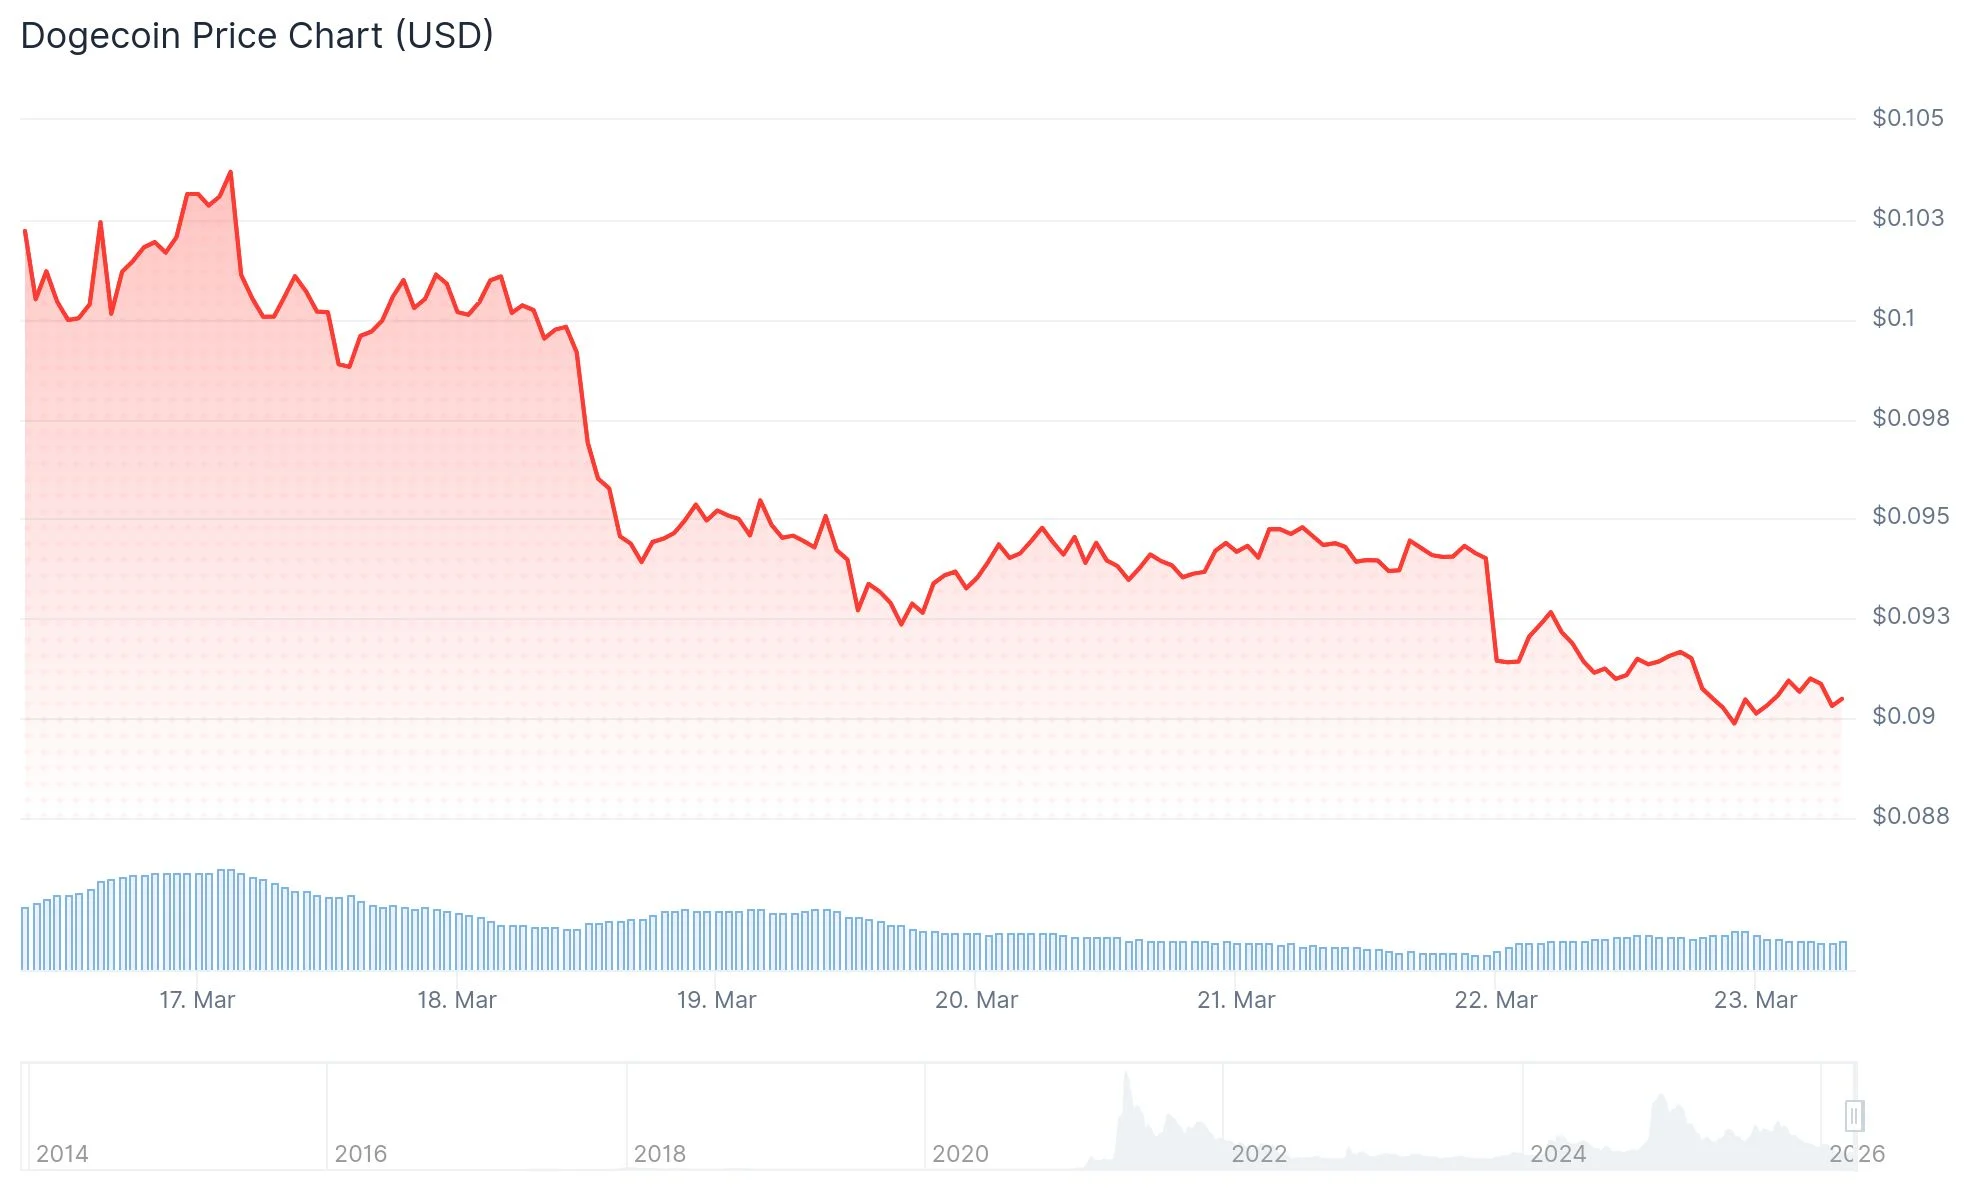
Dogecoin (DOGE) continues to trade in the vicinity of $0.094 as of March 21–22, 2026, confined within a prolonged technical pattern that market participants are monitoring with growing interest.
Following its May 2021 peak of $0.73, the memecoin has experienced a substantial 73% pullback, settling into an extended period of sideways movement. Weekly chart analysis reveals a series of descending peaks forming a triangle pattern, with price support maintaining stability in the $0.055 to $0.08 corridor.
CryptoPatel, a technical market analyst, drew attention to this formation, observing that DOGE currently hovers near the top boundary of this prolonged consolidation zone. The pattern indicates that market volatility has diminished as downward momentum weakens.
Crypto Lens, another market observer, identifies a significant 5-year demand region positioned near $0.07867. Historical data shows that comparable pattern breakouts generated returns of +173%, +180%, and +421%, though historical performance doesn’t guarantee future price behavior.
Wave Theory and Momentum Divergence Analysis
Certain technical analysts are interpreting the current price structure using Elliott Wave methodology. According to this perspective, DOGE appears to be nearing completion of its fifth and terminal corrective wave segment, with Fibonacci projection zones clustering between $0.093 and $0.094.

Should this corrective wave conclude around present price levels, market bulls may initiate tests of overhead resistance spanning $0.098–$0.10.
In parallel analysis, Javon Marks has detected a hidden bullish divergence pattern developing in the $0.093–$0.095 zone. While price action establishes higher low formations above $0.09, momentum indicators simultaneously create lower lows — a configuration frequently linked to diminishing bearish momentum.
Marks projects that if this divergence pattern materializes as expected, DOGE could experience an upward move exceeding 350%, potentially reaching price levels above $0.44 from the current $0.093 area.
Critical Price Zones Under Surveillance
TradingView’s aggregate indicator assessments continue to display a “Sell” signal across moving average calculations. Momentum oscillators such as the RSI and Stochastic indicators remain predominantly neutral territory.
Market participants are closely tracking these price zones:
- Overhead resistance: $0.095 and $0.098
- Psychological barrier: $0.10
- Downside support: $0.092 and $0.088–$0.090
A decisive weekly candle close beyond the descending trendline, accompanied by rising volume activity, would provide the strongest bullish confirmation signal. Technical projection models indicate that a sustained break above the $0.10 threshold could activate measured move targets spanning the $0.20–$0.30 range.
Blockchain analytics from Glassnode and IntoTheBlock platforms document daily active address counts fluctuating between 60,000 and 110,000, while daily transaction volumes vary from 80,000 to 200,000.
As of March 22, 2026, Dogecoin changed hands at $0.09191, reflecting a 2.81% decline over the previous 24-hour period. The $0.09 support threshold represents the critical structural foundation that traders continue to observe closely.
Get 3 Free Stock Ebooks
Discover top-performing stocks in AI, Crypto, and Technology with expert analysis.
- Top 10 AI Stocks - Leading AI companies
- Top 10 Crypto Stocks - Blockchain leaders
- Top 10 Tech Stocks - Tech giants


