
 Price: Falling Wedge Pattern Captures Market Attention")
Key Takeaways
- A falling wedge formation has emerged on DOGE’s daily timeframe, a pattern frequently associated with significant price movements.
- Critical resistance exists between $0.105 and $0.11, coinciding with important Fibonacci levels.
- Relative Strength Index readings have climbed out of oversold zones and are moving toward neutral territory with modest bullish signals.
- The 50-day exponential moving average presents a significant obstacle above current trading levels, and breaking above it would signal a genuine trend reversal.
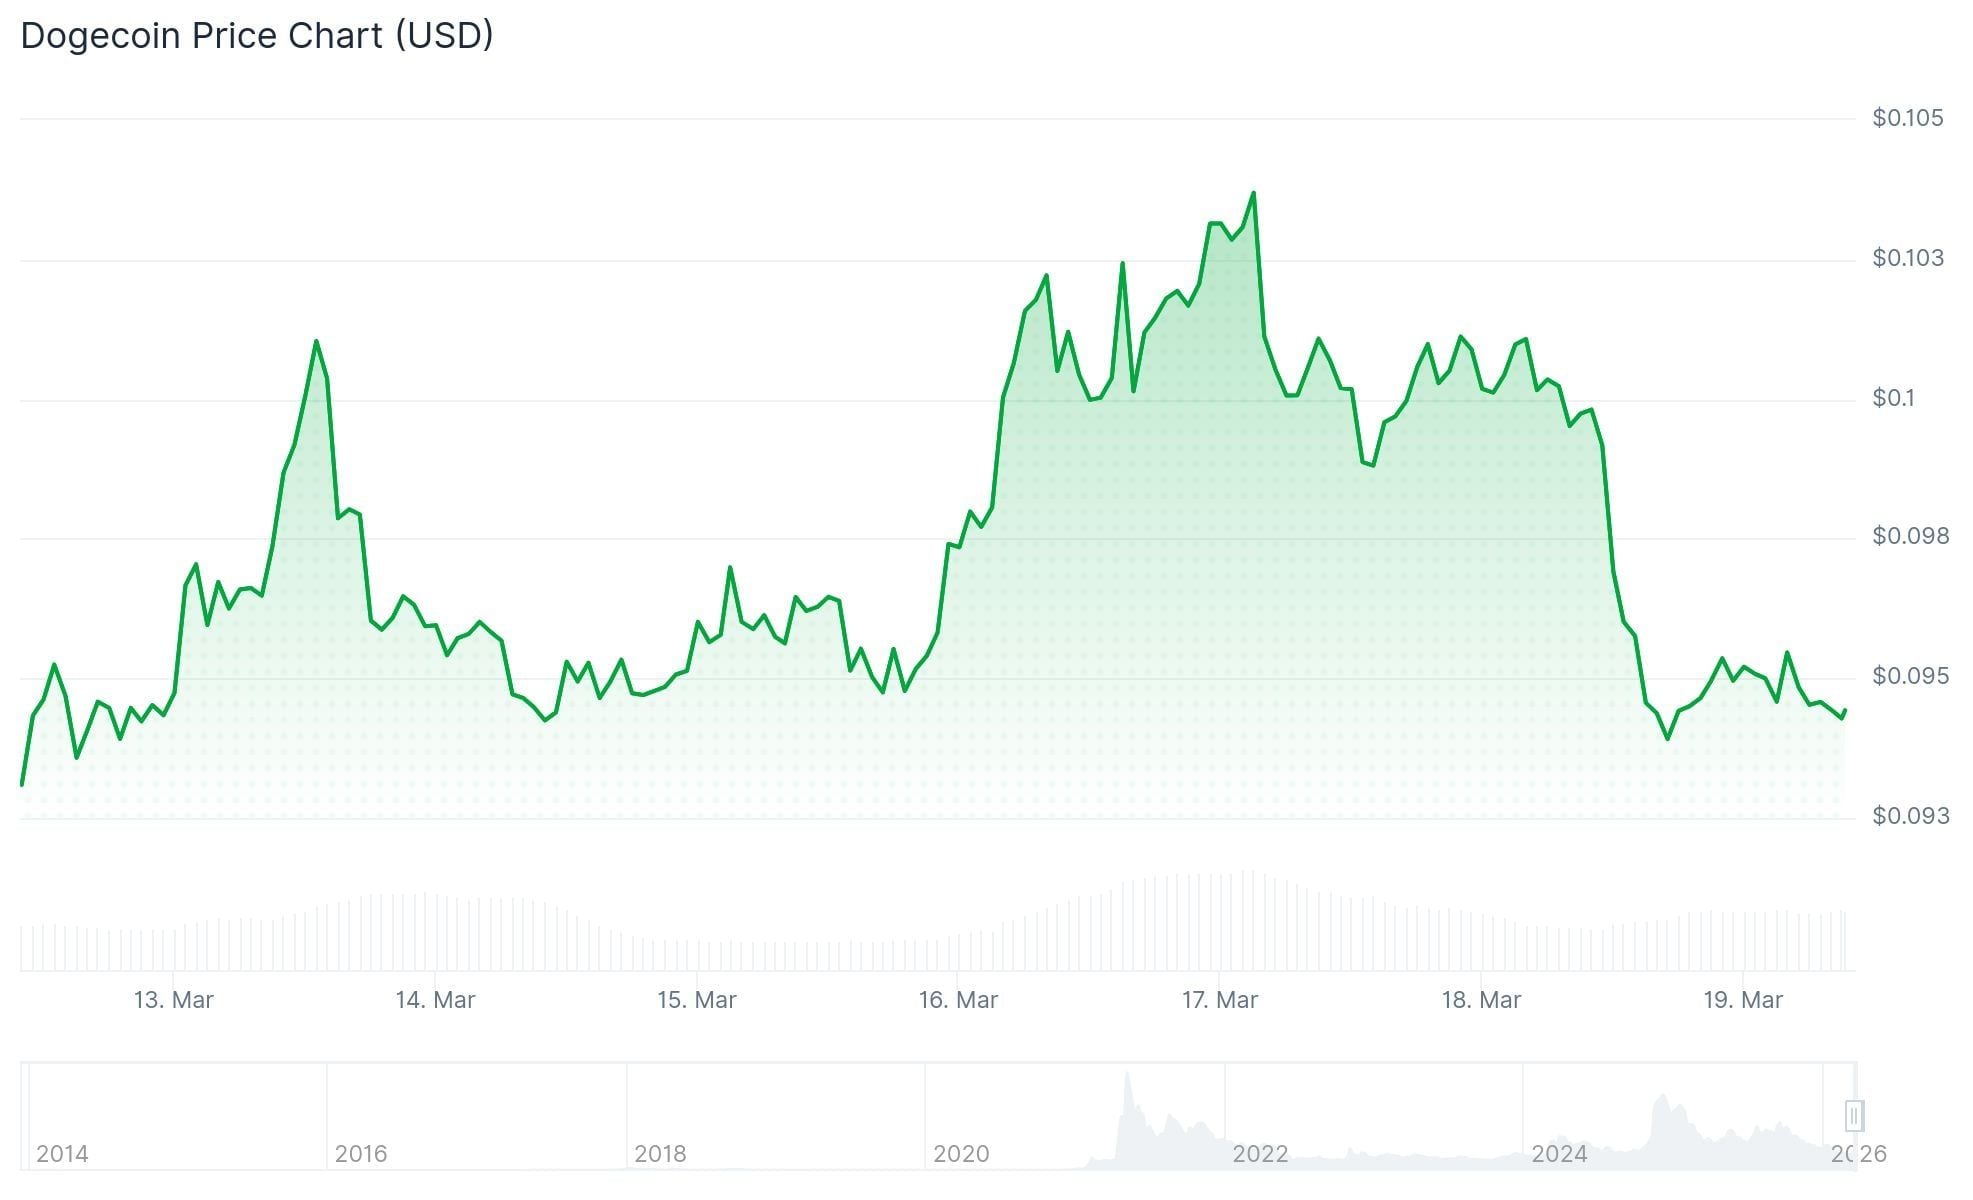
- On March 18, DOGE was changing hands around $0.094, registering nearly a 5% decline over 24 hours.
Dogecoin continues to consolidate near the $0.10 threshold, forming a tightening structure that market participants are monitoring with keen interest. This technical configuration has drawn scrutiny due to historical precedents suggesting significant price action may follow—though near-term direction remains uncertain.
Technical analysts have identified a falling wedge pattern developing on DOGE’s daily timeframe. This chart structure features progressively lower peaks while troughs converge, creating a narrowing price channel. Historical data indicates that when this compression reaches critical levels, a breakout typically emerges. Long-term holders enduring the recent decline are anticipating an upward resolution.
This consolidation phase initiated following a corrective period that came after substantial earlier rallies. Throughout this timeframe, Dogecoin has been establishing lower peaks while downside pressure diminishes, indicating potential exhaustion among sellers.
Key Resistance Zones Block Recovery Attempts
The immediate challenge for any bullish reversal lies within the $0.105 to $0.11 range. This zone aligns precisely with the 0.5 to 0.618 Fibonacci retracement measurements calculated from the latest price decline. Additionally, this area intersects with clustered short-term exponential moving averages, creating a concentrated barrier to upward movement.
The $0.10 level has been tested repeatedly throughout the previous twelve months. During each instance where price pushed above this mark, selling pressure emerged to force it lower once again. Market observers note this recurring rejection has diminished $0.10’s effectiveness as dependable support.

A decisive breach above $0.11 could establish pathways toward $0.116, followed by $0.136 as subsequent targets. However, current pricing remains beneath the 50-, 100-, and 200-day moving average indicators, maintaining an overall bearish market structure.
As of March 18, DOGE was trading around $0.094, reflecting a 4.84% intraday decline.
Breaking the 50-Day EMA Remains Critical
Even should DOGE successfully penetrate the $0.11 barrier, the 50-day exponential moving average looms immediately overhead and has been shadowing the downtrend throughout the correction phase. This dynamic indicator continuously adjusts with price action, making sustained breakouts above it particularly challenging to maintain.
Historical price behavior demonstrates that regaining control above the 50 EMA has consistently marked the initial reliable indication that DOGE’s broader trend is reversing. Absent this technical confirmation, market analysts view any rally beyond $0.10 as temporary relief rather than genuine trend reversal.
The Relative Strength Index has rebounded from oversold territory and currently rests near the neutral midpoint with slight bullish inclination. The MACD indicator is similarly approaching a potential bullish crossover signal, implying that selling momentum is weakening.
Current market data confirms DOGE remains supported above its longer-term base at $0.086, representing the most recent local bottom before the current rebound attempt.
Get 3 Free Stock Ebooks
Discover top-performing stocks in AI, Crypto, and Technology with expert analysis.
- Top 10 AI Stocks - Leading AI companies
- Top 10 Crypto Stocks - Blockchain leaders
- Top 10 Tech Stocks - Tech giants


