
 Price Analysis: Tight Bollinger Bands Signal Imminent Volatility")
Key Takeaways
- DOGE remains under selling pressure, trading beneath the declining 50-day EMA
- Funding rates have turned negative with short positions outnumbering longs
- Critical support zone established at $0.0879 — breaking below risks decline toward $0.0800
- Resistance at $0.0930 must be conquered for bulls to challenge the $0.10 level
- Contracting Bollinger Bands on the daily timeframe suggest significant volatility approaching
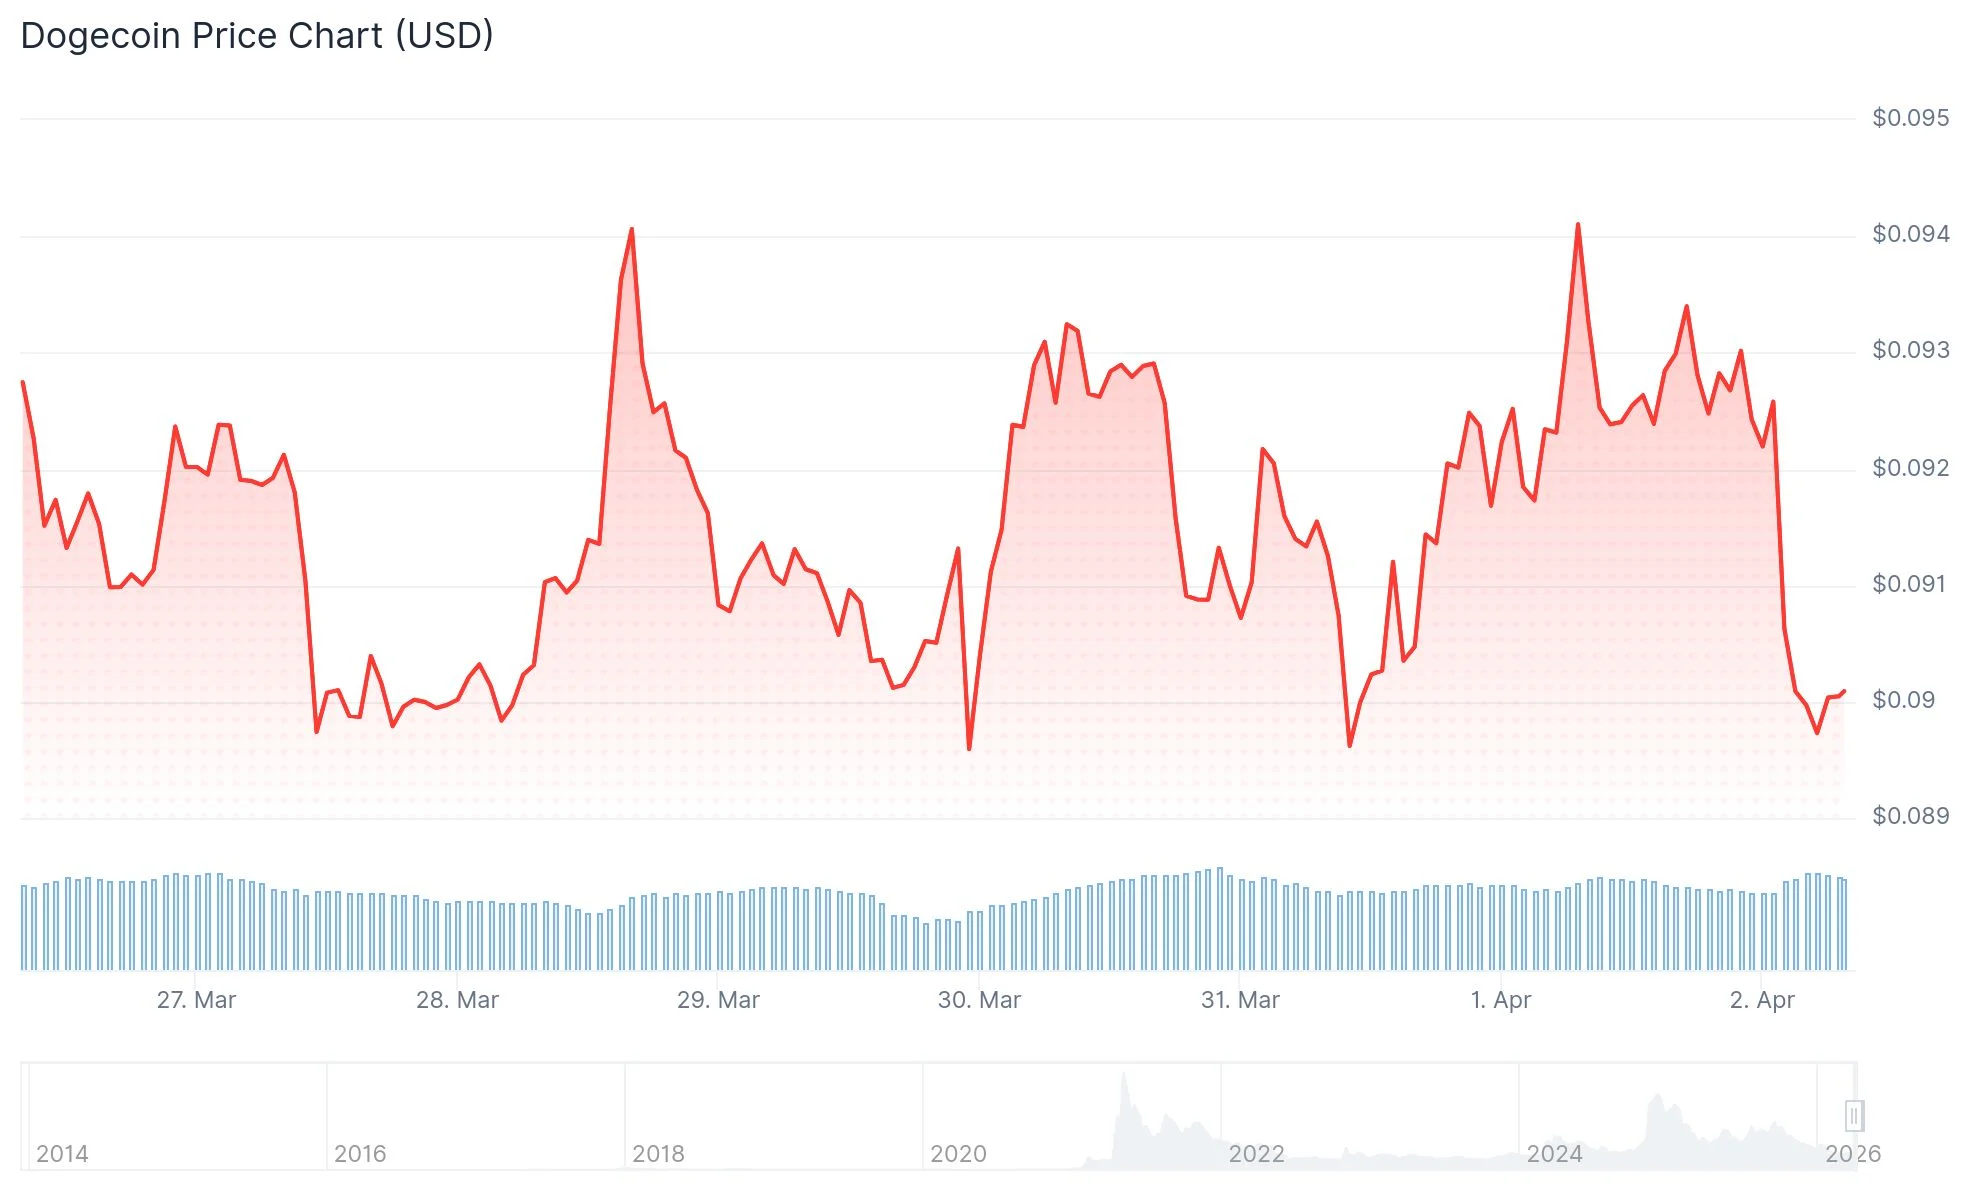
Dogecoin currently changes hands at approximately $0.0926, registering a 2.28% gain over the last 24-hour period. Despite this modest uptick, the cryptocurrency faces continued resistance near the $0.0930 threshold. The digital asset remains confined within a narrow trading corridor as market participants await a definitive directional catalyst.
The token touched a 24-hour bottom at $0.0890 before finding buyer support. This reversal propelled the price sequentially through $0.0905, $0.0912, and $0.0920 levels. The rally managed to reclaim the 50% Fibonacci retracement measured from the recent swing high of $0.0937 down to $0.0893.
Technical chart analysis reveals a descending trendline on the hourly timeframe, establishing resistance around $0.0928. This coincides with the 76.4% Fibonacci retracement level, creating a formidable double barrier. Sellers have consistently protected this zone across multiple tests.
The cryptocurrency maintains positioning above both the $0.0912 mark and the 100-hour simple moving average. While this supports a mildly constructive near-term outlook, the margin remains thin and vulnerable to shifts in sentiment.
Futures Market Shows Bearish Positioning
Market derivatives metrics indicate bearish trader positioning across Dogecoin futures. Data from CoinGlass reveals total Open Interest currently at $1.05 billion, reflecting a 0.81% contraction over 24 hours. Liquidation activity totaled $4.55 million during this window, with long position liquidations accounting for $3.48 million of that figure.

The long-to-short ratio among active positions registers at 0.967, demonstrating that short sellers slightly outnumber bullish traders. Funding rates have declined into negative territory at -0.0097%, indicating short position holders are compensating longs to maintain their bearish bets.
Market analyst Ali Charts highlighted on X that Dogecoin’s daily chart displays compressing Bollinger Bands. This technical configuration typically precedes substantial price movement, though the eventual direction remains undetermined until the breakout occurs.
Critical Price Zones Under Observation
For upward momentum, DOGE must decisively breach the $0.0928–$0.0930 resistance cluster to target $0.0950 initially, followed by $0.0980. Clearing $0.0980 would establish a foundation for testing the psychologically significant $0.10 threshold, with $0.1020 representing the subsequent objective.
The 50-day exponential moving average currently resides at $0.0974, while the 100-day EMA sits at $0.1107, both functioning as overhead technical barriers.
Regarding downside vulnerability, immediate support emerges at $0.0915. The $0.0900 psychological level represents a more substantial floor beneath current prices. Should a daily candle settle below $0.0879—the February 11 swing low—DOGE could face pressure toward $0.0800, with $0.0741 as an extended downside target.
The Relative Strength Index on the hourly chart maintains readings above the 50 neutral threshold, while the MACD indicator persists in positive territory despite showing momentum deceleration. On the daily timeframe, the RSI hovers near 43, positioned below the midpoint and reflecting mild bearish undertones.
Current market structure shows DOGE successfully defending the $0.0912 short-term support level, with the $0.0930 resistance zone representing the primary obstacle for buyers as the next trading session unfolds.
Get 3 Free Stock Ebooks
Discover top-performing stocks in AI, Crypto, and Technology with expert analysis.
- Top 10 AI Stocks - Leading AI companies
- Top 10 Crypto Stocks - Blockchain leaders
- Top 10 Tech Stocks - Tech giants


