



Key Takeaways
- DOGE trades within a contracting pennant formation where declining highs and ascending lows are nearing convergence.
- Analysis of the market capitalization reveals a comparable triangle pattern approaching a resistance trendline, with potential upside to $73.19 billion upon breakthrough.
- Current price action tests the 0.618 Fibonacci fan zone, echoing the 0.5 Fib fan bounce that sparked the rally to $0.48 in late 2024.
- Critical support zone established at $0.095; losing this threshold on a weekly timeframe could invalidate the bullish structure.
- Market analyst Trader Tardigrade identifies parallels between current accumulation and historical phases in 2015, 2019, and 2025 that preceded significant rallies.
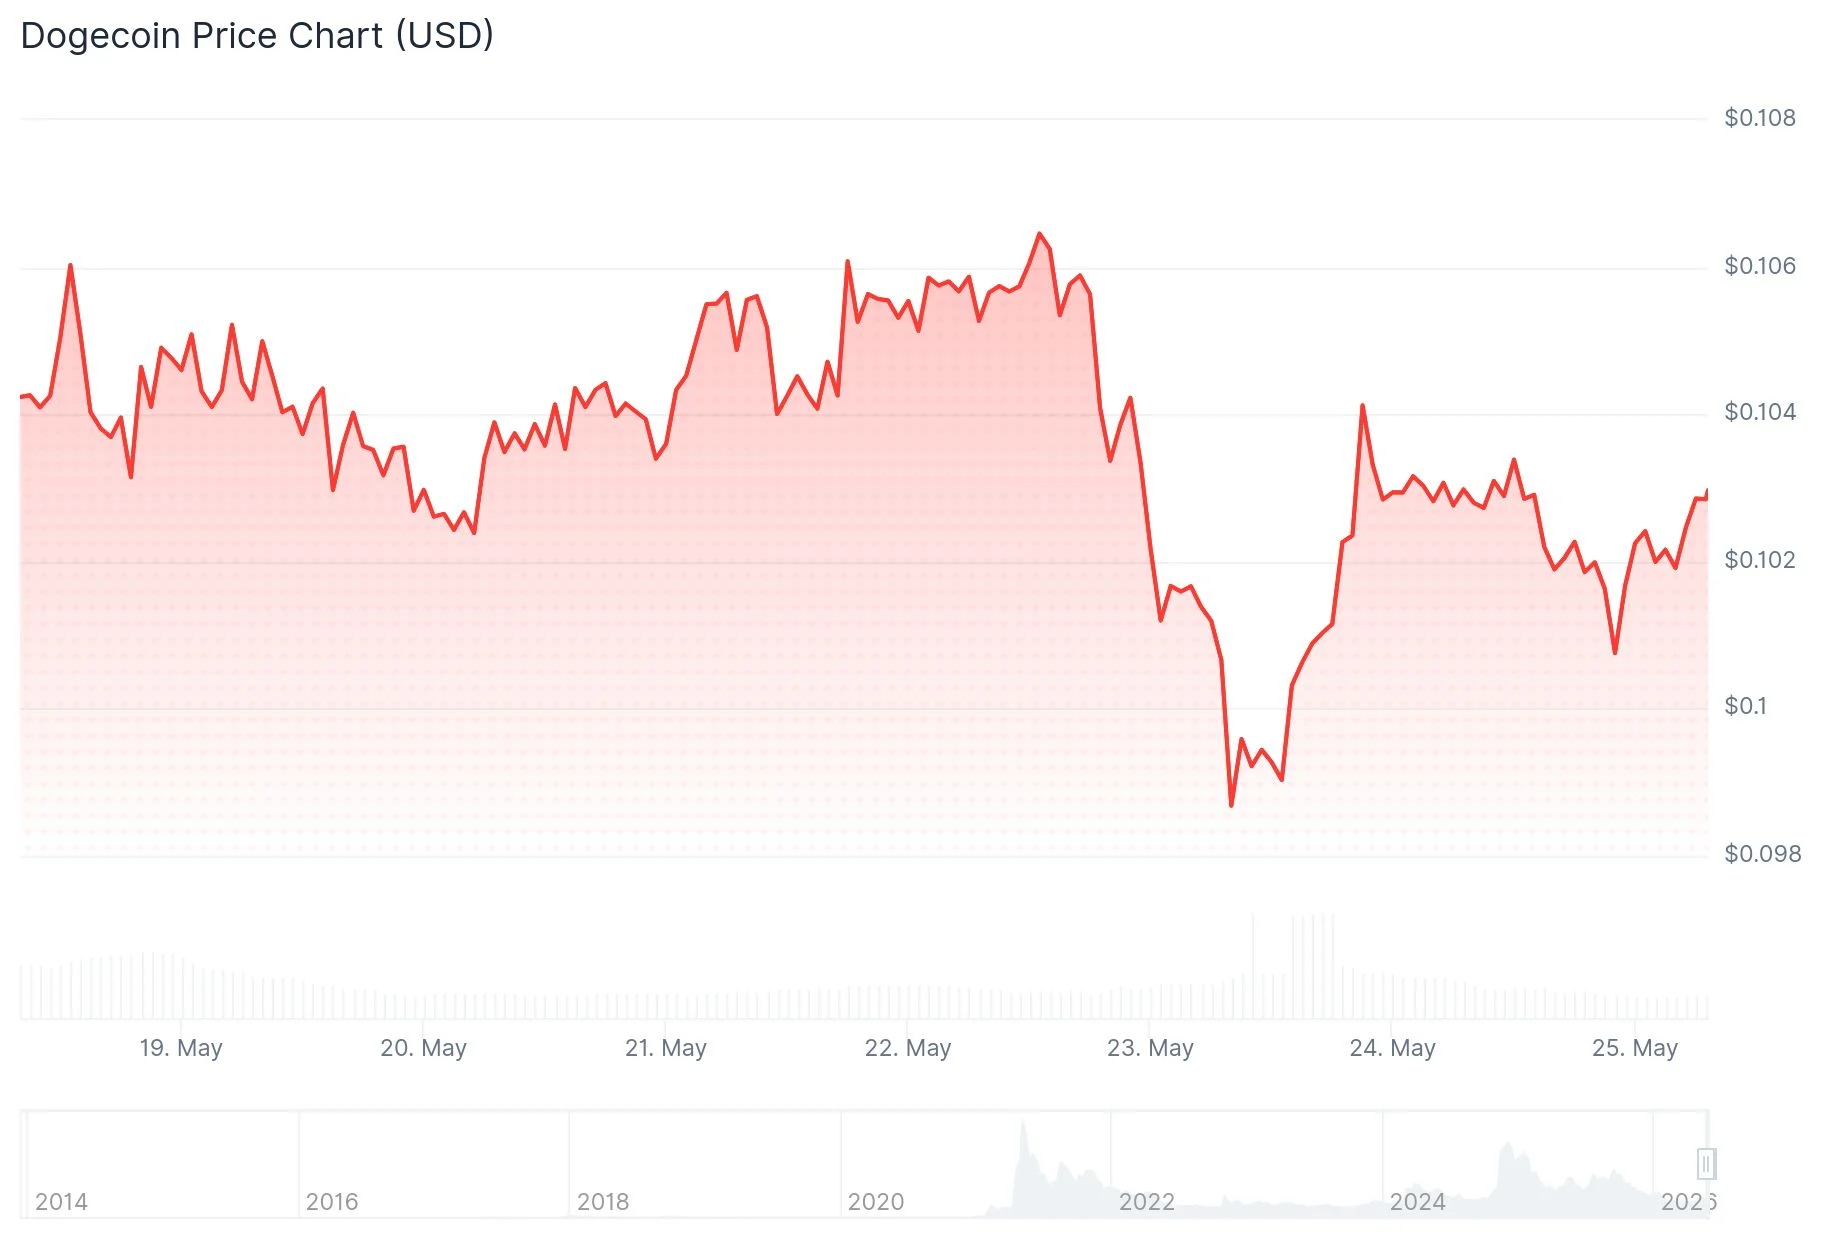
Dogecoin (DOGE) finds itself at a crucial technical juncture. Trading near $0.1028, the memecoin remains trapped within dual compression formations that technical analysts believe will dictate its next substantial price swing.
The primary formation is an extended pennant visible on the daily chart. According to a technical breakdown posted by analyst Bitcoinsensus on X, DOGE has been establishing declining peaks alongside ascending troughs following its previous rally high. This configuration generates a tightening wedge as price action compresses toward a convergence point.
The pennant’s upper boundary has consistently rejected upward advances. Multiple attempts by bulls to breach this resistance have been turned back by sellers defending the line. Conversely, the ascending lower boundary has provided reliable support dating back to the 2022 bottom, with DOGE respecting this floor through numerous retests.
A definitive breakout remains elusive. Unless DOGE produces a decisive close beyond the overhead resistance, continued consolidation within this contracting range appears likely.
Market Capitalization Reveals Parallel Compression
The compression narrative gains support when examining Dogecoin’s total market capitalization. Analyst DonWedge presented a chart illustrating how the market cap is similarly confined within an elongated triangle, approaching its apex where descending resistance from the 2021 high meets ascending support.

Should market cap successfully pierce through the highlighted yellow resistance zone, the technical projection points toward a $73.19 billion objective, per the analysis. Present valuation remains significantly distant from this target. The critical vulnerability lies with the lower purple support boundary. A breach below this foundation would compromise the validity of the entire compression thesis.
Neither the price nor market cap chart currently displays confirmed breakout signals.
Fibonacci Fan Analysis Echoes 2024 Rally Conditions
An alternative technical perspective employing a Fibonacci fan constructed from the 2021 peak of $0.7316 suggests conditions may be aligning for a replay of October 2024 dynamics. During that period, DOGE successfully retested and defended the 0.5 Fibonacci fan level before surging to $0.48 by December 2024.
Presently, the chart illustrates DOGE engaging with the 0.618 Fibonacci fan zone within the $0.10 to $0.11 corridor. This configuration was identified by analyst @_CryptoSurf on X through TradingView.
For this scenario to materialize, buyers must defend $0.095 on weekly closing basis and propel price beyond $0.115, subsequently reclaiming $0.14. Alternatively, a weekly candle close beneath $0.095 would suggest extended consolidation spanning $0.095 down to $0.08.
Analyst Trader Tardigrade (TATrader_Alan) provided commentary on the DOGE monthly timeframe, asserting that 2025-2026 exhibits striking resemblance to historical accumulation windows observed during 2015-2017 and 2019-2020, both of which preceded substantial bull runs. He characterized the present environment as “the best accumulation period” and emphasized that each previous DOGE accumulation phase culminated in parabolic price appreciation.
As of this writing, Dogecoin trades at $0.1028.
Get 3 Free Stock Ebooks
Discover top-performing stocks in AI, Crypto, and Technology with expert analysis.
- Top 10 AI Stocks - Leading AI companies
- Top 10 Crypto Stocks - Blockchain leaders
- Top 10 Tech Stocks - Tech giants



