
 Eyes Major Breakout: Analyst Predicts 30% Price Swing")
Key Takeaways
- DOGE slipped beneath the $0.0930 threshold, reaching a bottom around $0.0903
- Current trading activity sits under the 100-hourly simple moving average
- Technical charts reveal a descending triangle pattern on the 4-hour timeframe
- Crypto analyst Ali Martinez highlights increasing probability of a 30% price movement
- MACD indicator generated a “Buy” signal while RSI and Bull Bear Power stay Neutral
Dogecoin experienced a notable retreat following its inability to maintain support above the $0.0930 mark. The digital asset breached several critical support zones, bottoming out at approximately $0.0903 before staging a modest rebound. Currently, DOGE hovers beneath the $0.0920 level and remains under the 100-hourly simple moving average.
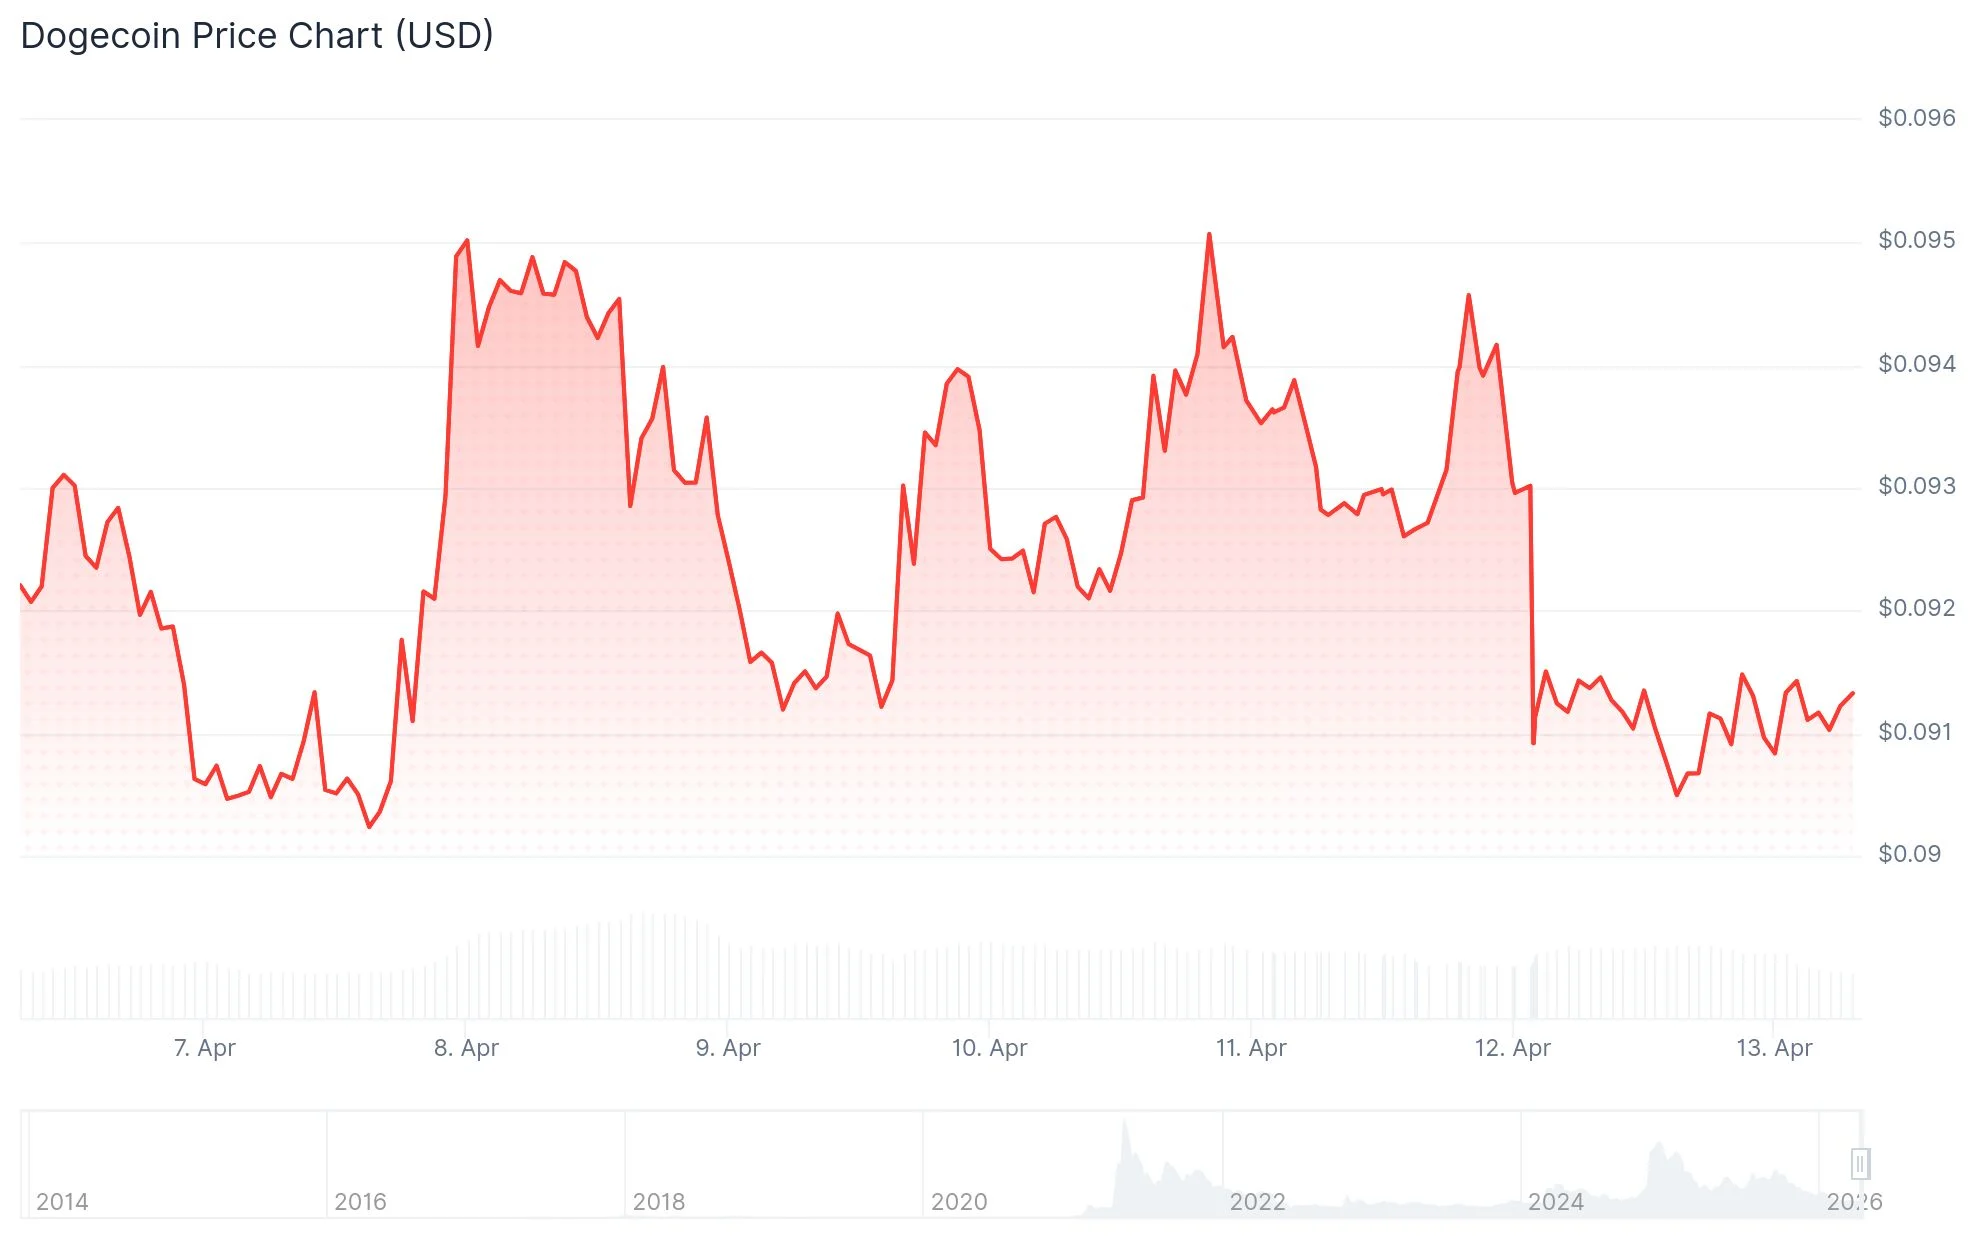
The hourly chart revealed a breach of a bullish trend line positioned at $0.0925, introducing additional downward pressure to near-term price action. The subsequent recovery attempt encountered resistance below the 23.6% Fibonacci retracement level, measured from the decline spanning $0.0948 down to $0.0903.
Looking at potential resistance zones, the initial hurdle emerges at $0.0925, coinciding with the 50% Fibonacci retracement of the recent downward movement. Additional resistance barriers appear at $0.0930 and $0.0938. Successfully clearing these levels could pave the way toward $0.0950 and potentially $0.0980.
Regarding downside targets, immediate support emerges at $0.0905. The next cushion lies at $0.0900, followed by a more substantial support floor at $0.0880. Should DOGE breach the $0.0880 level, the meme coin could descend toward $0.0820 or potentially test $0.0800.
30% Price Swing on the Horizon, Says Analyst
On April 12, cryptocurrency analyst Ali Martinez shared observations via X, drawing attention to a descending triangle configuration visible on Dogecoin’s 4-hour chart. Martinez stated: “As Dogecoin $DOGE moves closer to the apex of this triangle, the chances of a 30% move increase substantially.” The analyst refrained from indicating whether this anticipated movement would be bullish or bearish. Should the breakout materialize to the upside, a 30% surge would propel DOGE toward the $0.11 zone, territory last visited during early February.

This pattern identification marks a recurring theme in Martinez’s recent market commentary. The analyst has consistently referenced this triangle formation across multiple analyses.
Futures Market and Technical Signals
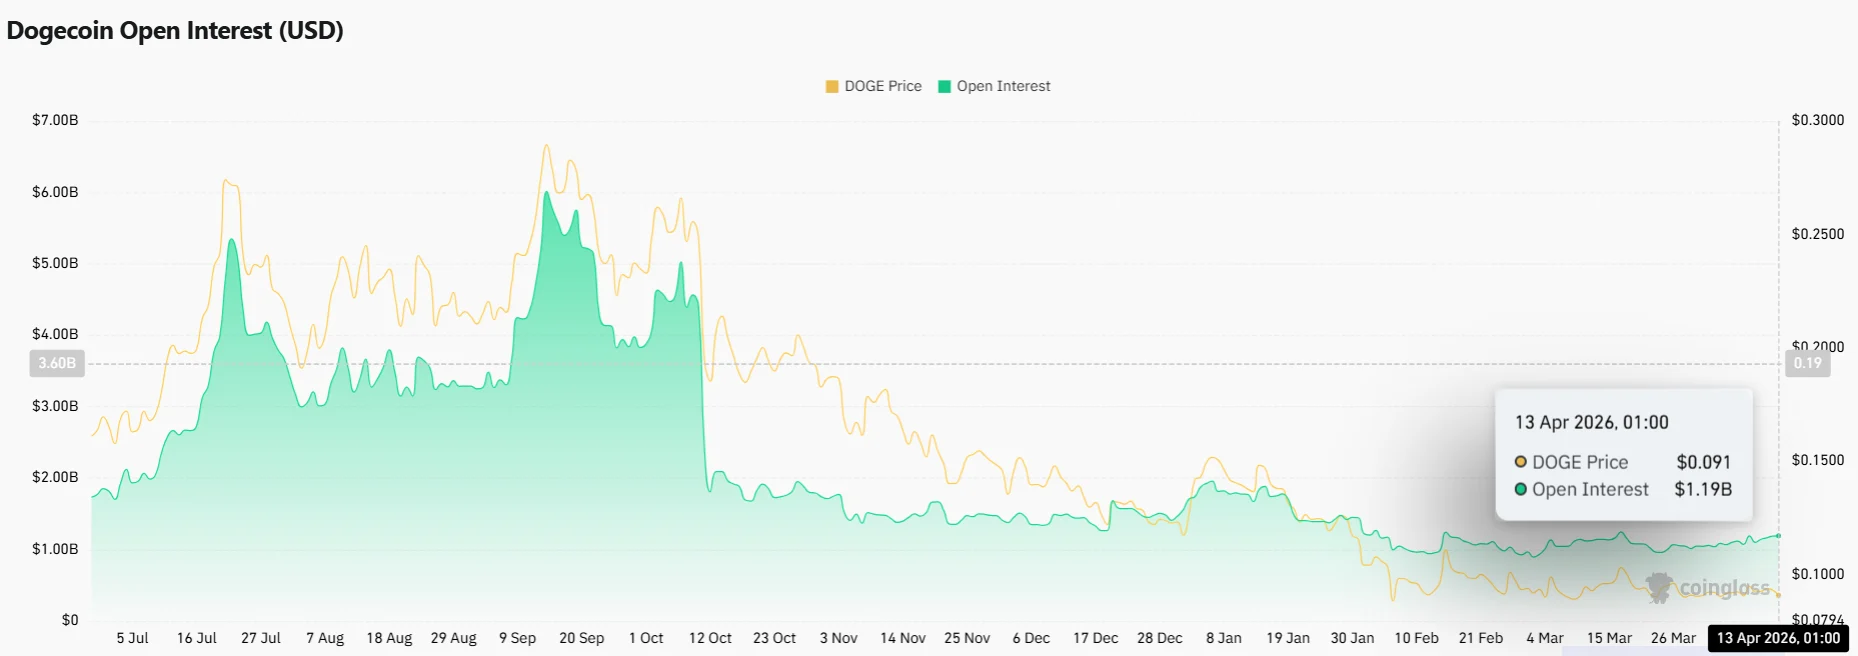
According to Coinglass data, open interest in DOGE futures climbed 1.61% during the previous 24-hour period. When open interest expands amid sideways price movement, it typically indicates a consolidation period preceding a more substantial directional move.
Large-scale traders operating in the derivatives marketplace maintained a bullish stance. Meanwhile, retail trader sentiment transitioned to “Neutral.”
Technical indicators present a mixed picture. The MACD indicator on TradingView generated a “Buy” signal for DOGE. However, both the Bull Bear Power indicator and the Relative Strength Index registered Neutral readings.
Throughout the current month, Dogecoin has predominantly traded within a narrow range, constrained by broader cryptocurrency market headwinds. Coinglass tracking shows the 1.61% increase in DOGE futures open interest over the past day signals growing trader interest despite the sideways price action.
Get 3 Free Stock Ebooks
Discover top-performing stocks in AI, Crypto, and Technology with expert analysis.
- Top 10 AI Stocks - Leading AI companies
- Top 10 Crypto Stocks - Blockchain leaders
- Top 10 Tech Stocks - Tech giants


