
 Price Analysis: Will April Bring the Breakout Bulls Need?")
Key Takeaways
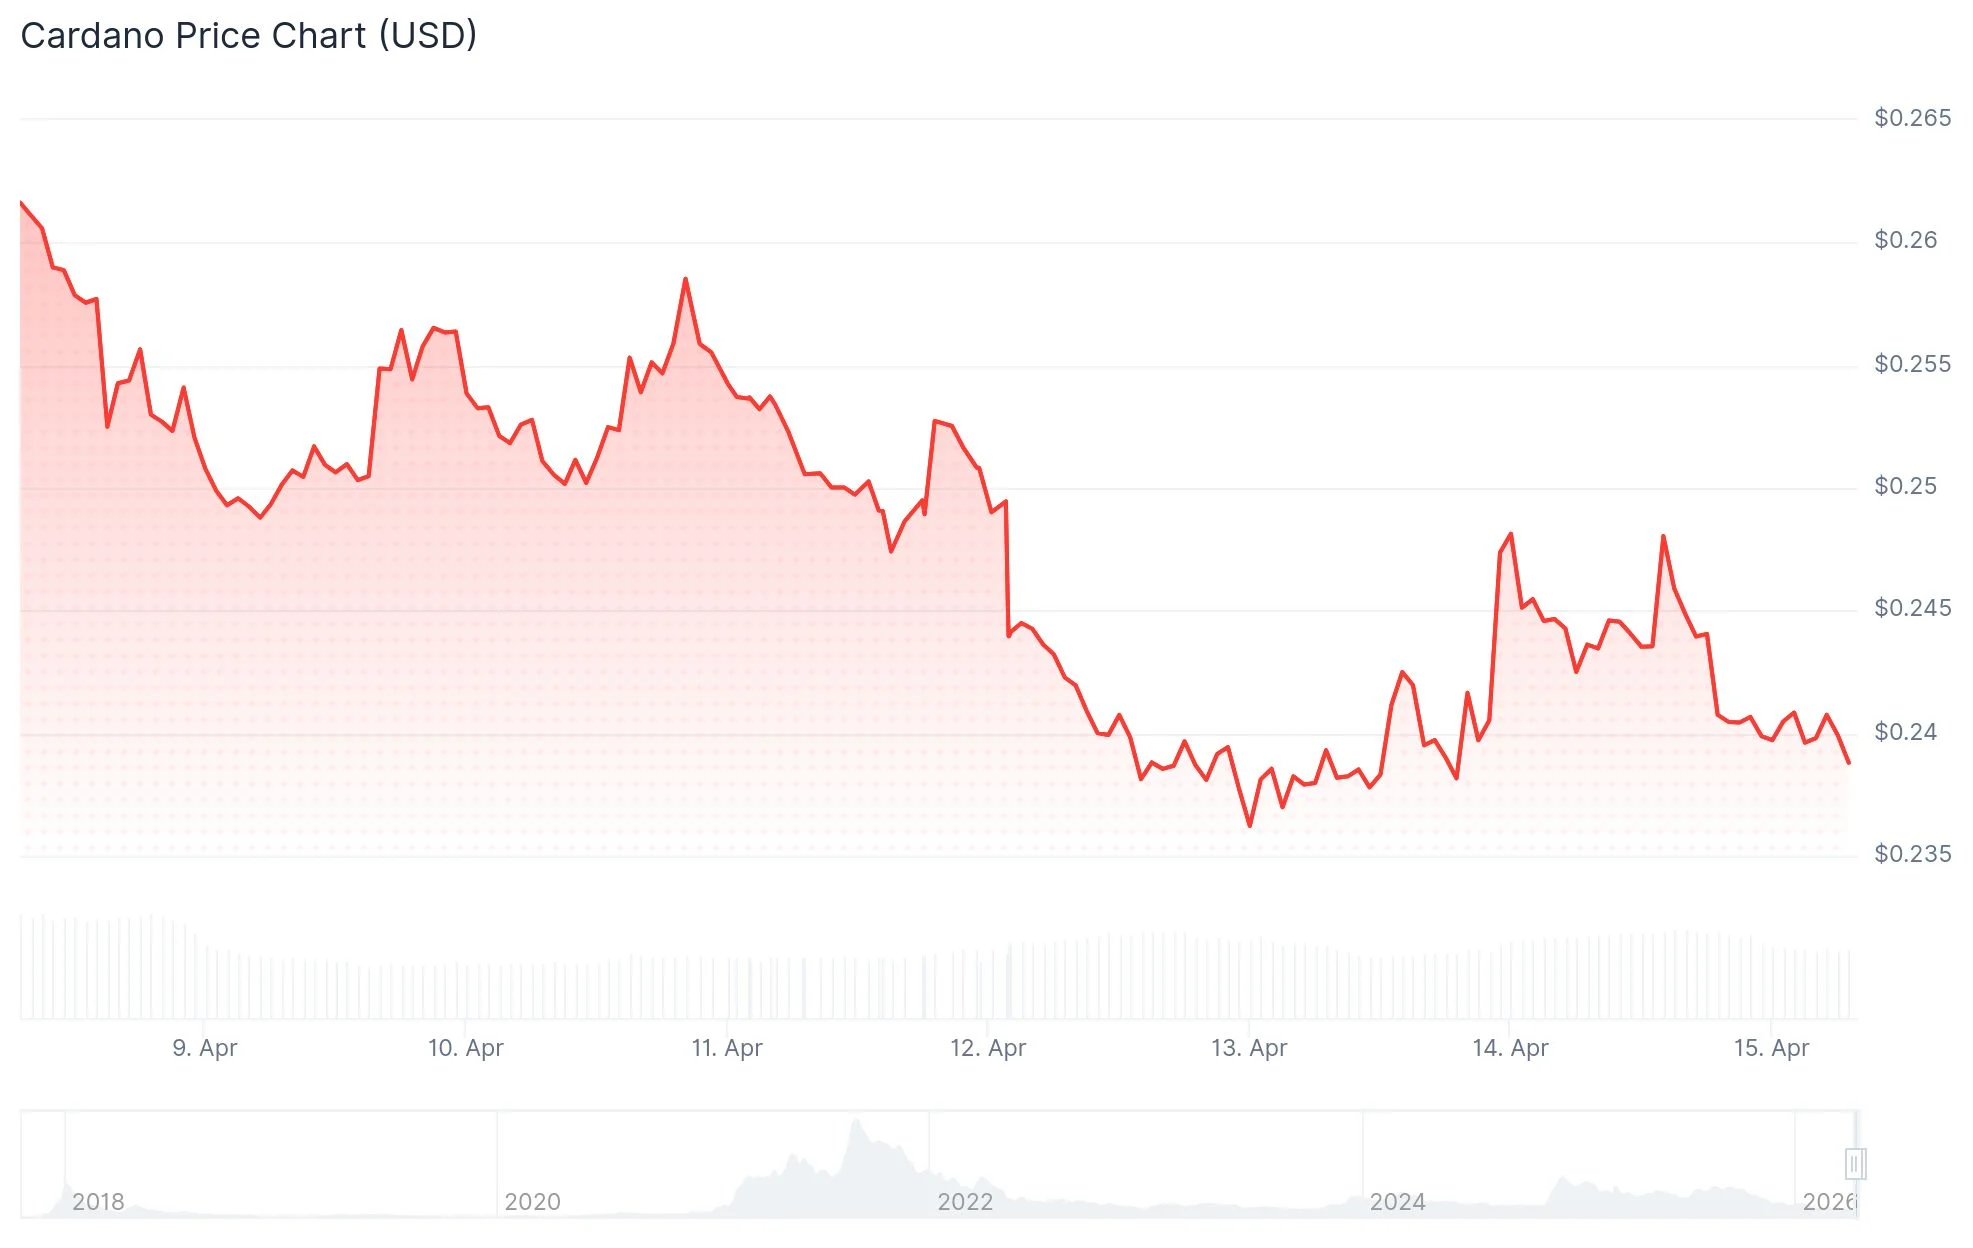
- Cardano currently hovers between $0.239 and $0.243, posting a nearly 4% decline on Wednesday’s session
- On-chain metrics indicate dormant wallet movements and a negative NPL spike pointing to early investor capitulation
- The altcoin trades beneath its 50, 100, and 200-day EMAs with bearish momentum signals
- While BTC climbed 8.7% and ETH surged 13.2% in the past week, ADA remained essentially stagnant
- Critical support level rests at $0.220; a breakdown below $0.243 might trigger a decline toward $0.10 yearly lows
Cardano (ADA) is currently changing hands between $0.239 and $0.243 during Wednesday’s trading session, experiencing a nearly 4% pullback following rejection from a crucial resistance zone on Tuesday. The digital asset continues to underperform relative to major cryptocurrencies like Bitcoin and Ethereum, which have delivered weekly gains of 8.7% and 13.2% respectively. In contrast, ADA has shown minimal movement during the same timeframe.
Blockchain analytics from Santiment reveal a concerning negative spike in the Network Realized Profit/Loss (NPL) metric on Tuesday. This development indicates that holders were predominantly realizing losses during their sales. Simultaneously, the Age Consumed metric registered an upward spike, demonstrating that previously dormant tokens—digital assets that have been sitting idle in wallets for extended periods—are now being mobilized.

Market observers have noted a comparable pattern emerged in early December, which preceded a substantial price correction. Technical analysts are now monitoring closely to determine whether history might repeat itself given the current market dynamics.
Bearish Technical Indicators Dominate
Cardano’s price action remains firmly positioned below its 50-day, 100-day, and 200-day Exponential Moving Averages (EMAs). The 50-day EMA currently stands at $0.262, while the Relative Strength Index (RSI) on the daily timeframe hovers around 43. The MACD indicator displays a slightly negative reading, suggesting limited upward momentum in the near term.
Immediate resistance confronts bulls at $0.245. A decisive daily candle closure above this threshold would represent the first constructive signal, potentially unlocking pathways to $0.262 and subsequently $0.271. On the downside, primary support is established at $0.220, which corresponds to the recent cyclical bottom.

Data from CoinGlass indicates the long-to-short ratio registered at 0.95 on Wednesday. A ratio beneath the 1.0 mark signals that a greater number of market participants are betting on further price depreciation. This bearish positioning has persisted throughout the majority of March.
Crypto analyst Ali Charts highlighted via social media that ADA has circled back to a critical “make-or-break” threshold at $0.243. He characterized this zone as a historically significant pivot point and cautioned that should bulls prove unable to maintain it on a daily closing basis, ADA could face exposure to a more pronounced correction targeting yearly lows around $0.10. Conversely, if buyers successfully defend this level, he projects a potential upside move toward $0.30.
Derivatives and Exchange Flow Data Signal Bearish Sentiment
Cardano has additionally struggled to secure a daily close above its 50-day Simple Moving Average (SMA) since early October 2025. Following the breach below this moving average that month, the token has plummeted approximately 70% from $0.819.
Futures market data compiled by CoinGlass reveals $207.5 million in capital entering derivative positions over the past 24-hour period, while $211.1 million exited. Open interest has also experienced a marginal decline. Spot exchange inflows measured $34.53 million compared to $32.78 million in outflows, indicating some token holders are transferring assets to exchanges—typically interpreted as a preliminary signal of impending selling activity.
As of Wednesday’s trading session, ADA was last quoted at $0.239.
Get 3 Free Stock Ebooks
Discover top-performing stocks in AI, Crypto, and Technology with expert analysis.
- Top 10 AI Stocks - Leading AI companies
- Top 10 Crypto Stocks - Blockchain leaders
- Top 10 Tech Stocks - Tech giants


