
 Tumbles Below $63K: Are We Headed for $50,000?")
TLDR
- BTC fell beneath the $63,000 threshold on February 24, 2026, losing close to 7% over the past seven days
- Significant whale accumulations are being transferred to trading platforms, suggesting increased sell pressure ahead
- Trump’s tariff escalation from 10% to 15% has triggered widespread risk-off sentiment in global markets
- Extreme fear dominates as the Bitcoin sentiment index registers an 8 reading
- Critical support zone established at $60,000; failure to hold could trigger a decline toward the $50,000 area
Bitcoin tumbled beneath the $63,000 mark on February 24, 2026, continuing a weeklong decline that has erased nearly 7% of its value.
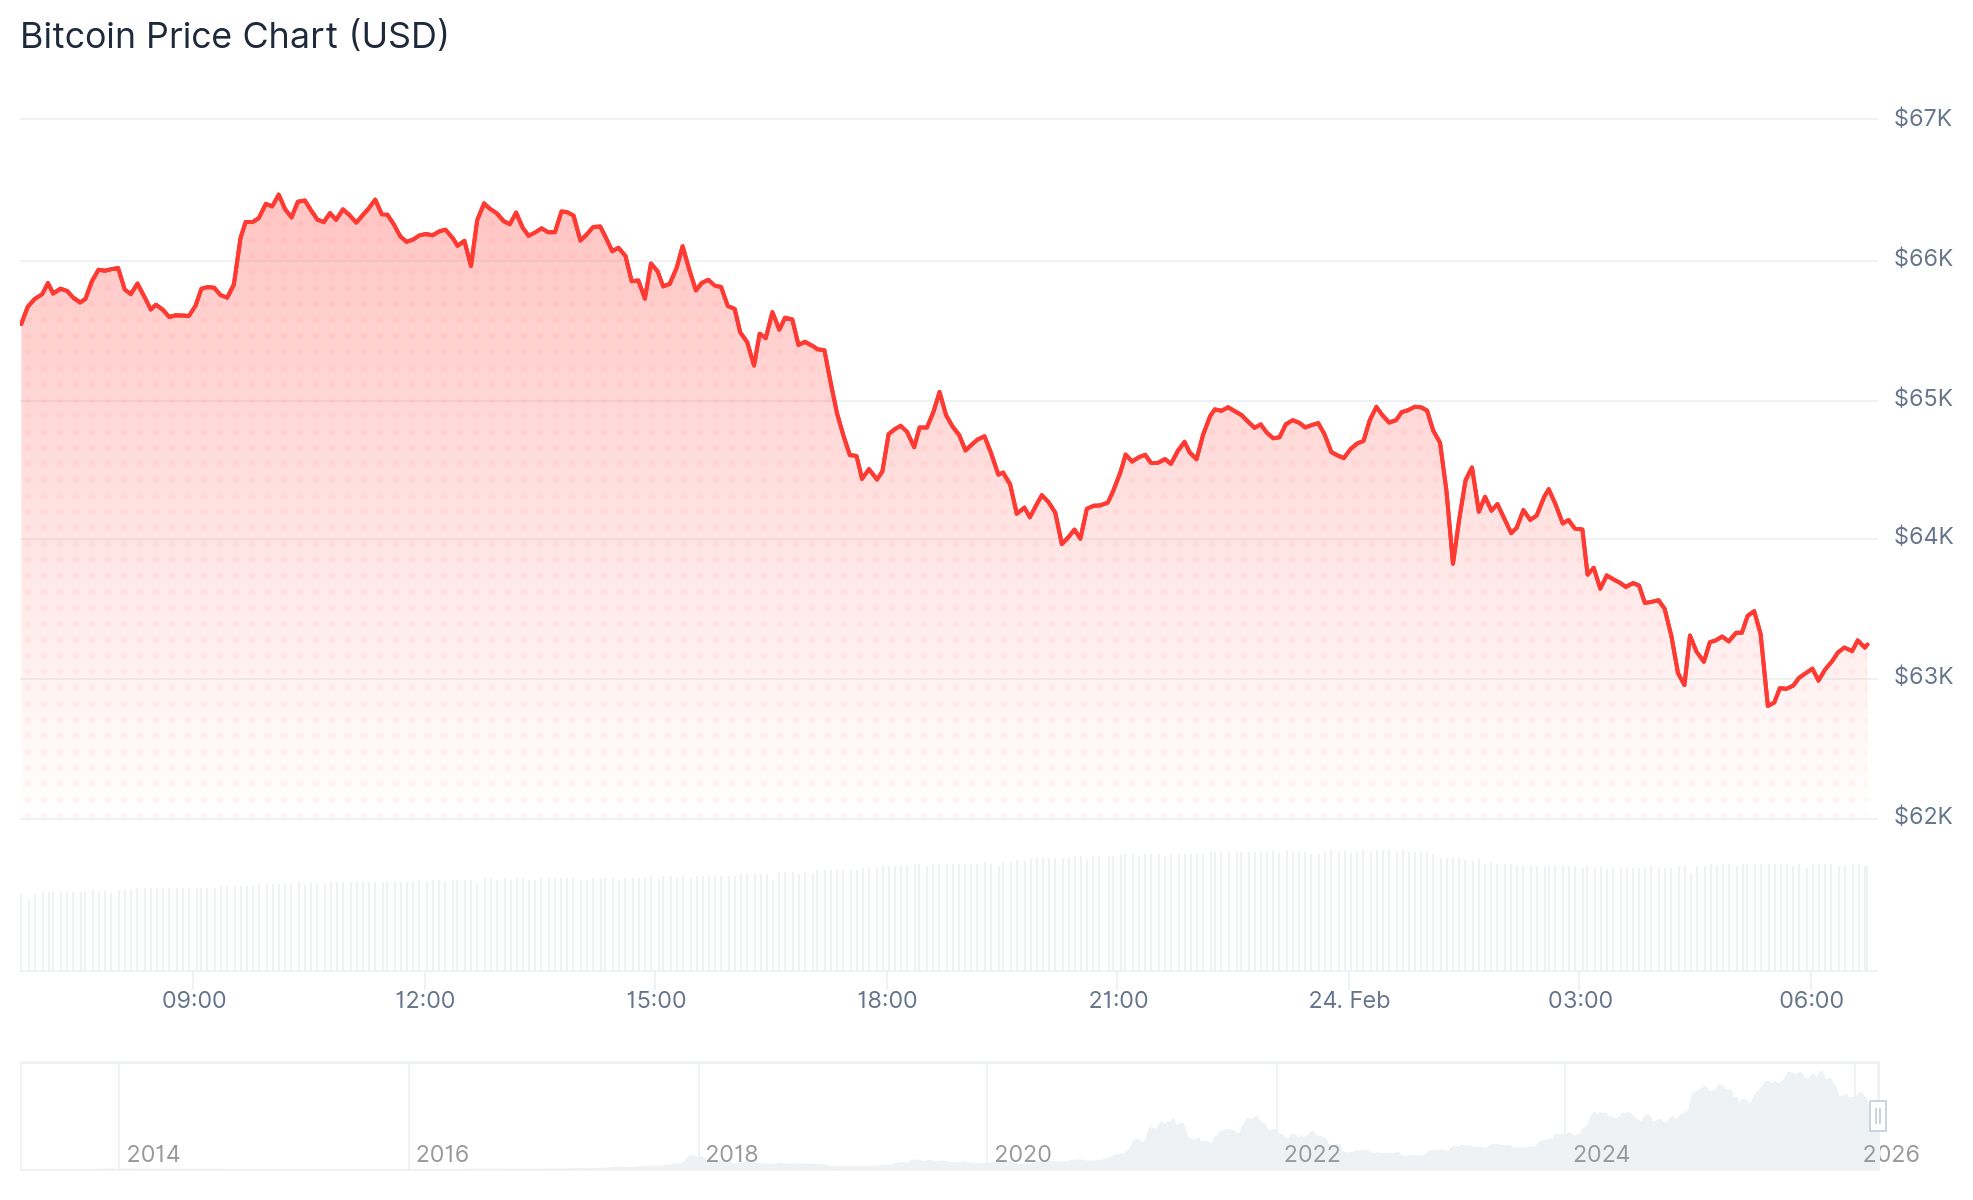
The decline pushed BTC to price levels not witnessed since the beginning of February, when the cryptocurrency momentarily dipped beneath $60,000.
As of this writing, Bitcoin was changing hands near $63,285, reflecting a roughly 4.5% decline over the previous 24-hour period.
Selling momentum has emerged from several sources simultaneously, creating significant obstacles for bullish traders attempting to restore upward momentum.
Blockchain analytics from CryptoQuant revealed that major Bitcoin holders, commonly referred to as whales, have been relocating substantial coin holdings from personal storage solutions to centralized trading venues.

Such movement patterns typically indicate preparation for distribution, effectively expanding the circulating supply available for trading.
Concurrently, purchasing momentum across leading exchanges has remained subdued, with broader cryptocurrency market sentiment continuing to deteriorate.
Tariff Uncertainty Weighs on Markets
President Trump’s trade policy decisions have emerged as a primary catalyst behind the ongoing market correction.
The U.S. Supreme Court invalidated a substantial component of his initial tariff framework, determining he had exceeded his executive authority.
Trump subsequently unveiled a 10% universal tariff on international imports, which was later escalated to 15%, representing the ceiling permitted under existing legislation.
The policy shift has created turbulence across financial markets more broadly, with equity indices declining as capital flows redirected toward traditional safe-haven assets like gold, which recovered the $5,200 threshold.
Matt Howells-Barby from Kraken drew parallels to tariff-induced market volatility experienced in April 2025.
He emphasized that market participants are intensely monitoring the $60,000 support zone. “If that level fails to hold, we could potentially see a move into the mid-to-low $50K range,” he explained.
The Bitcoin fear and greed index has collapsed to 8, marking its most pessimistic reading in considerable time, capturing the prevailing uncertainty gripping market participants.
Approximately $461 million worth of leveraged crypto positions were forcibly closed within a single 24-hour window, with long positions accounting for 93% of total liquidations.
What Historical Patterns Show
Bitcoin’s extended timeframe technical framework introduces additional bearish considerations to the market outlook.
Historical analysis demonstrates that BTC has never established a sustainable price floor until the 50-week moving average drops beneath the 100-week moving average.
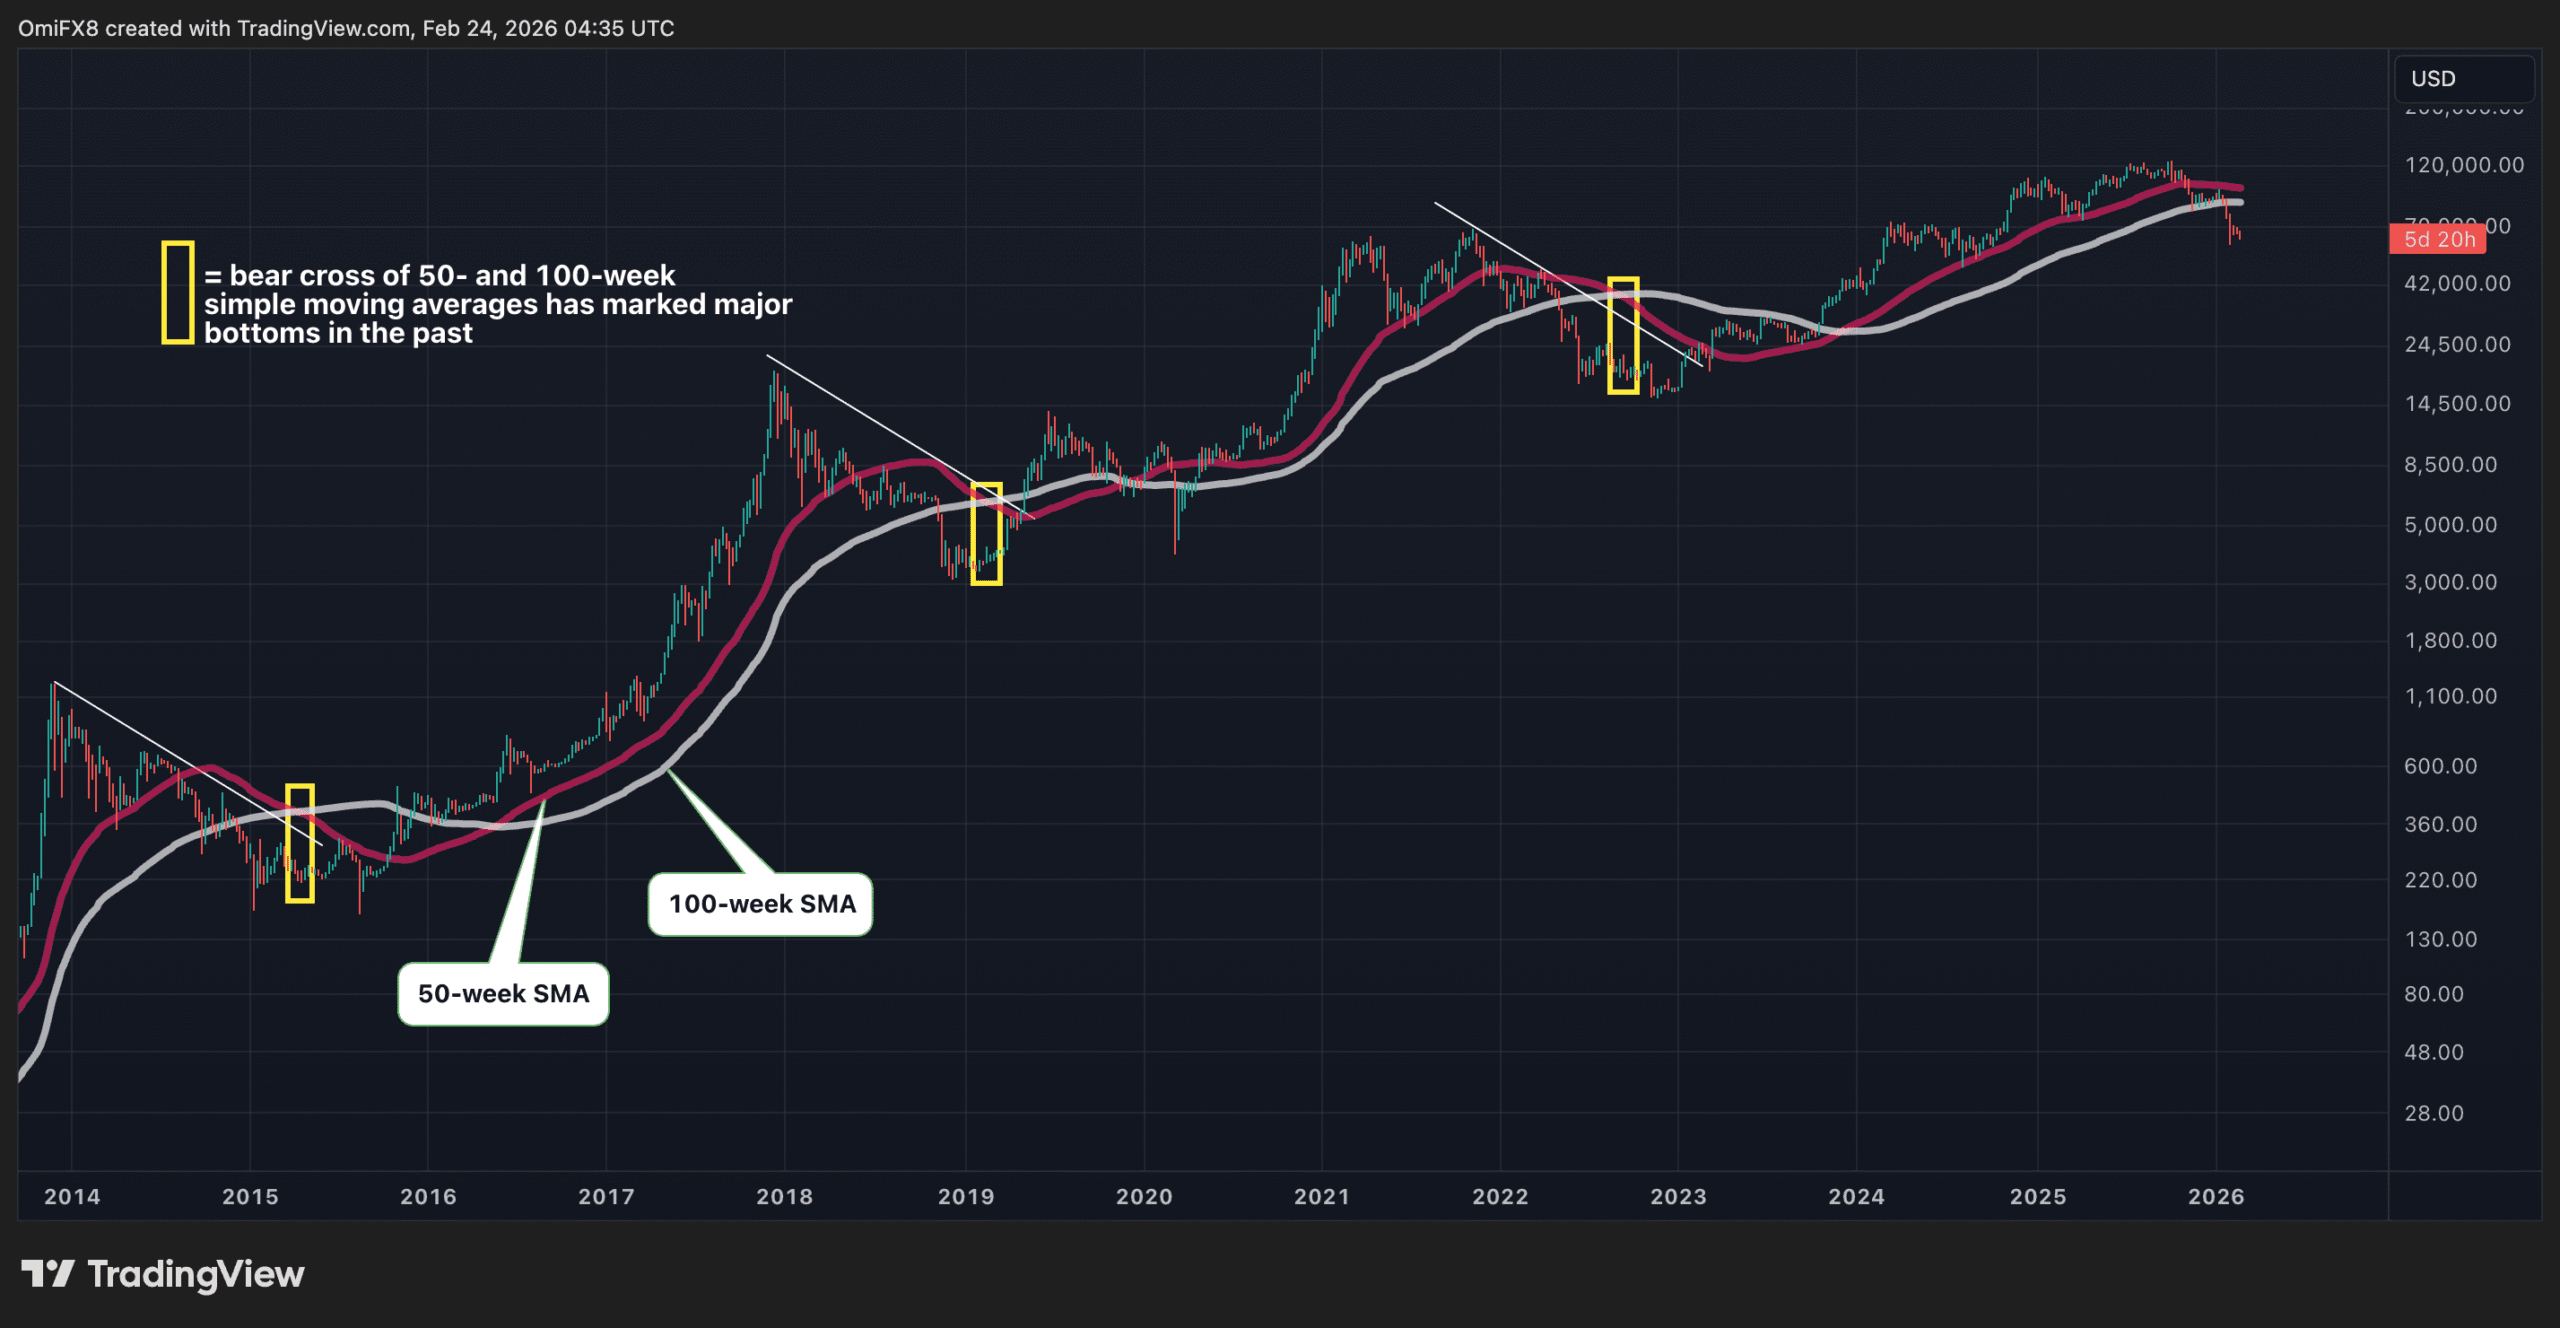
This technical indicator has reliably identified the conclusion of every significant bearish cycle, including those experienced in 2018 and 2022.
Presently, the 50-week moving average continues to trade substantially above the 100-week counterpart, indicating this crossover event has yet to materialize.
Market analyst Rashad Hajiyev has projected a consolidation phase around the $50,000 level, with a potential cyclical bottom approaching $30,000 during the fourth quarter of 2026.
Projections from CoinCodex suggest Bitcoin could climb to $79,579 by the conclusion of 2026 and potentially reach $166,372 by 2030.
Treasury Secretary Scott Bessent has suggested BTC could establish fresh all-time highs following the passage of comprehensive regulatory clarity legislation.
Get 3 Free Stock Ebooks
Discover top-performing stocks in AI, Crypto, and Technology with expert analysis.
- Top 10 AI Stocks - Leading AI companies
- Top 10 Crypto Stocks - Blockchain leaders
- Top 10 Tech Stocks - Tech giants


