
 Surges Past $73K as ETFs Inject $240M in Single-Day Buying Spree")
TLDR
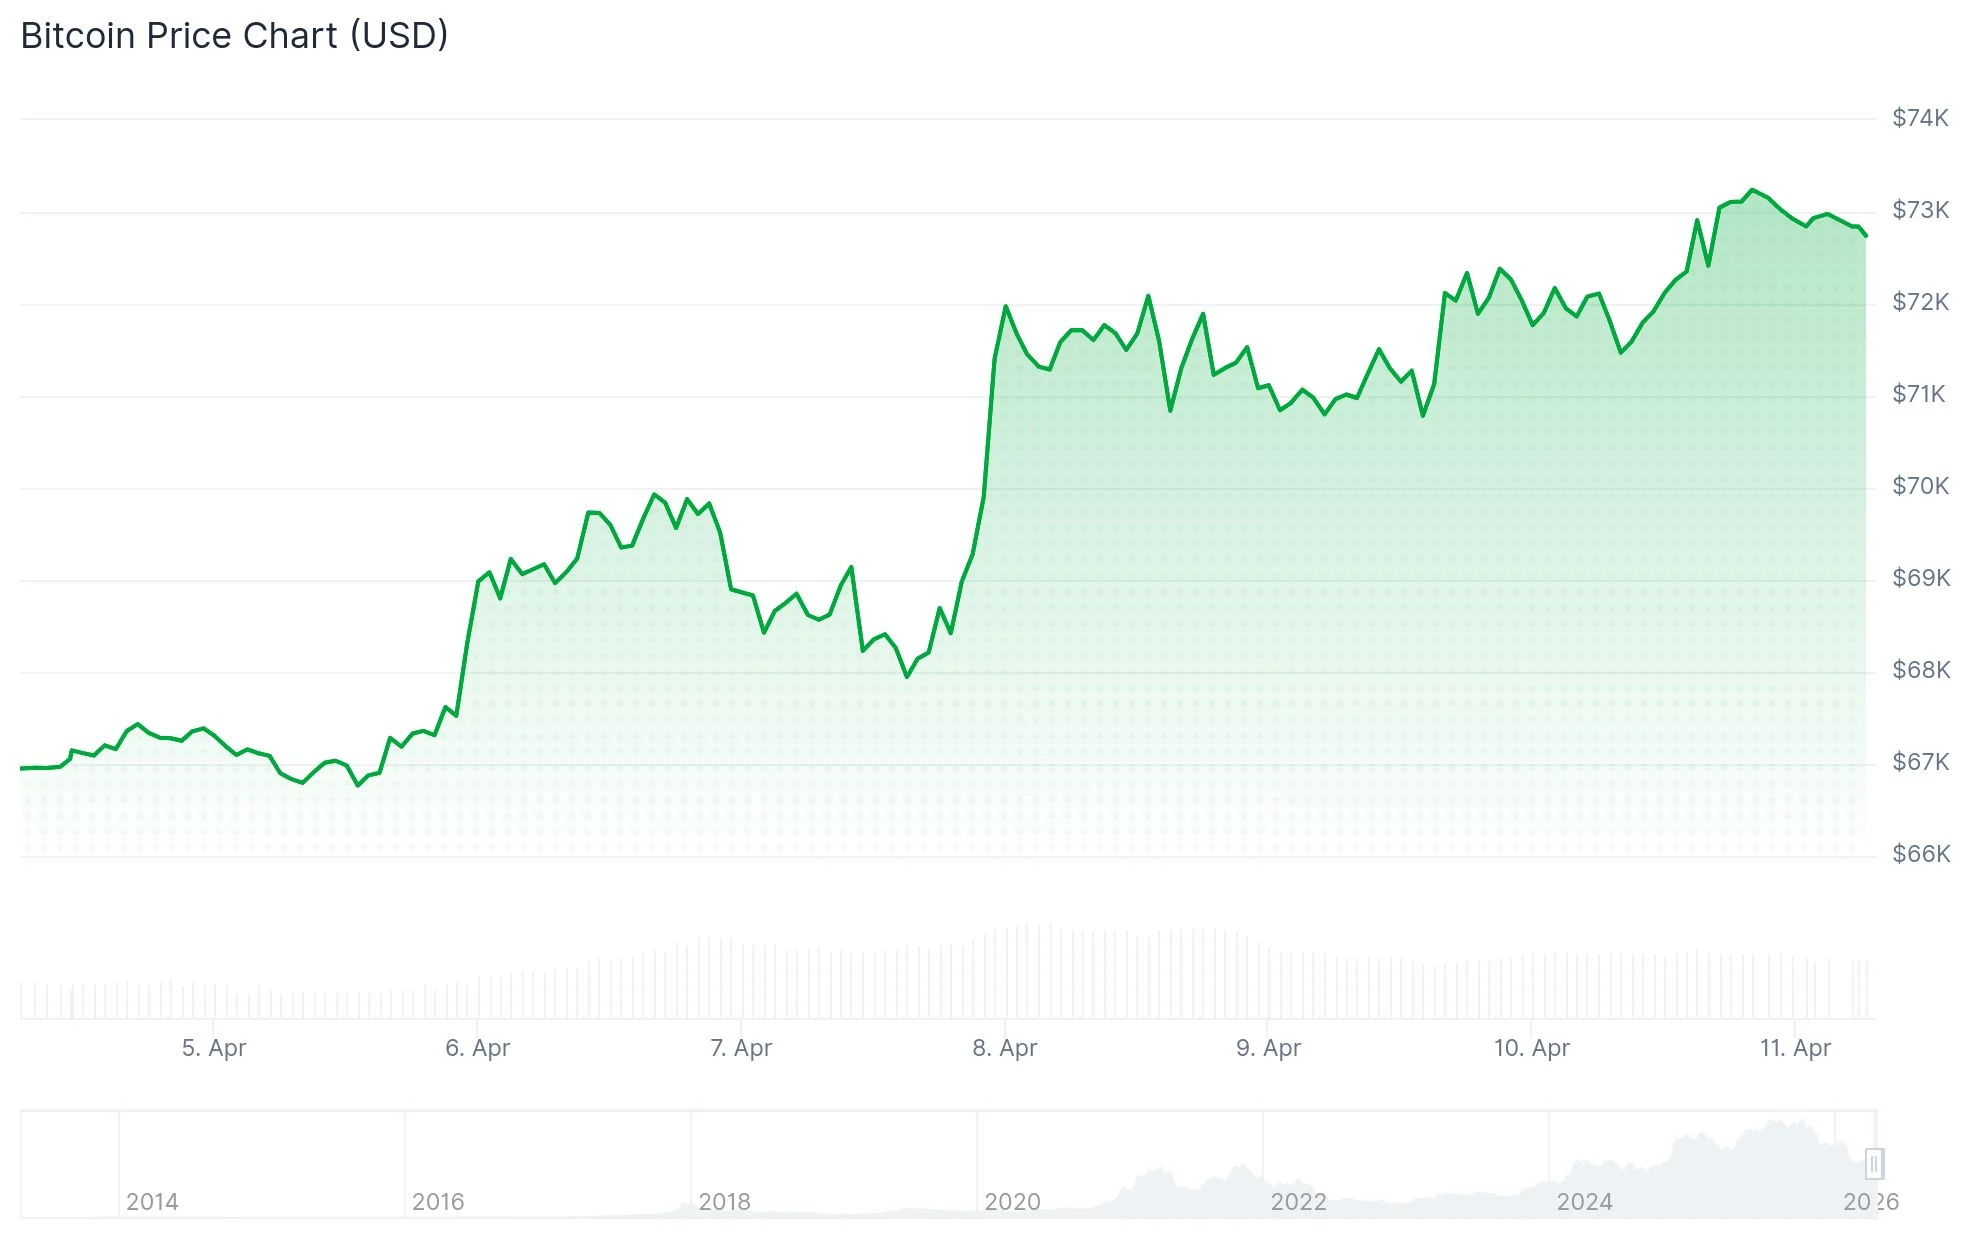
- Bitcoin surged past a bearish pennant formation, touching a six-week peak of $73,300
- Critical resistance zone identified by Glassnode between $78,000-$80,000
- Polymarket odds now show 26% probability of Bitcoin hitting $80,000 this month
- Spot Bitcoin ETFs accumulated 3,350 BTC valued at $240 million on Friday
- U.S.-Iran diplomatic progress and improved macro sentiment fueled nearly 9% weekly gains
Bitcoin surged beyond the $73,000 threshold on Friday, climbing to a six-week peak of $73,300 following a decisive break above what technical analysts had identified as a bear pennant formation on daily timeframes. The rally was accompanied by elevated trading volumes, suggesting genuine market conviction rather than low-liquidity price action.
The leading cryptocurrency demolished the pennant’s resistance trendline positioned at $70,000, registering a 7% single-session gain. During this advance, BTC recaptured multiple critical moving average levels, notably the 200-week exponential moving average at $68,350 and the 50-day EMA stationed at $70,580.
Chartists have also spotted a symmetrical triangle configuration developing on daily charts. Should this pattern reach its full measured move potential, the projected price objective extends to $87,000—approximately 20% beyond present trading levels. Additionally, the relative strength index displays bullish divergence, indicating strengthening momentum throughout the past two-month period.
The immediate technical obstacle facing Bitcoin is the 100-day exponential moving average positioned near $75,400. Failure to clear this barrier could undermine the current bullish momentum.
What Onchain Data Says About $80K
Onchain analytics provider Glassnode has identified a more defined upside boundary for the current rally. Their risk metrics highlight substantial resistance forming between the true market mean of $78,000 and the short-term holder realized price hovering around $80,000.

“Any rally into this zone is likely to encounter meaningful distribution pressure from recent buyers seeking to exit at or near breakeven,” Glassnode said in its latest Week Onchain report.
Their Entity-Adjusted URPD analysis reveals Bitcoin has moved into a relatively sparse supply zone spanning $72,000 to $82,000, with diminished overhead resistance within this corridor. That said, more than 1.3 million BTC were accumulated in the $82,000-$85,000 range, potentially forming a formidable supply wall.
Crypto analyst Ali Charts highlighted on X that $75,300 is functioning as a “magnet” for price action, pointing to substantial liquidity clustering just above the $72,000 level. According to his assessment, a push toward $75,300 could trigger liquidations of approximately $80 million in short positions, potentially creating a cascading effect.
ETF Demand and Macro Backdrop
On the institutional front, Bitcoin Archive documented on X that U.S. spot Bitcoin ETFs acquired 3,350 BTC valued at $240 million during Friday’s trading session. The collective ETF holdings now total 721,090 BTC, representing approximately $56.75 billion in assets under management.
Broader macroeconomic conditions also turned favorable for Bitcoin’s trajectory this week. Diplomatic progress toward a U.S.-Iran ceasefire bolstered risk appetite across financial markets, propelling BTC toward a weekly performance gain approaching 9%—marking its strongest weekly showing since October 2025.
March’s Consumer Price Index registered at 3.3%, predominantly influenced by a 10.9% spike in energy sector costs. Core inflation measurements, excluding volatile food and energy components, advanced a modest 0.2% month-over-month.
Polymarket prediction markets currently assign a 26% probability to Bitcoin reaching $80,000 before April concludes, representing a 5-percentage-point increase over the previous 24 hours. The likelihood of BTC touching $75,000 stands at 76%.
As of Friday’s close, Bitcoin ETF products collectively held 721,090 BTC with a market valuation of $56.75 billion.
Get 3 Free Stock Ebooks
Discover top-performing stocks in AI, Crypto, and Technology with expert analysis.
- Top 10 AI Stocks - Leading AI companies
- Top 10 Crypto Stocks - Blockchain leaders
- Top 10 Tech Stocks - Tech giants


