
 Slides Under $80K Mark as Traders Monitor Critical Price Thresholds")
Key Takeaways
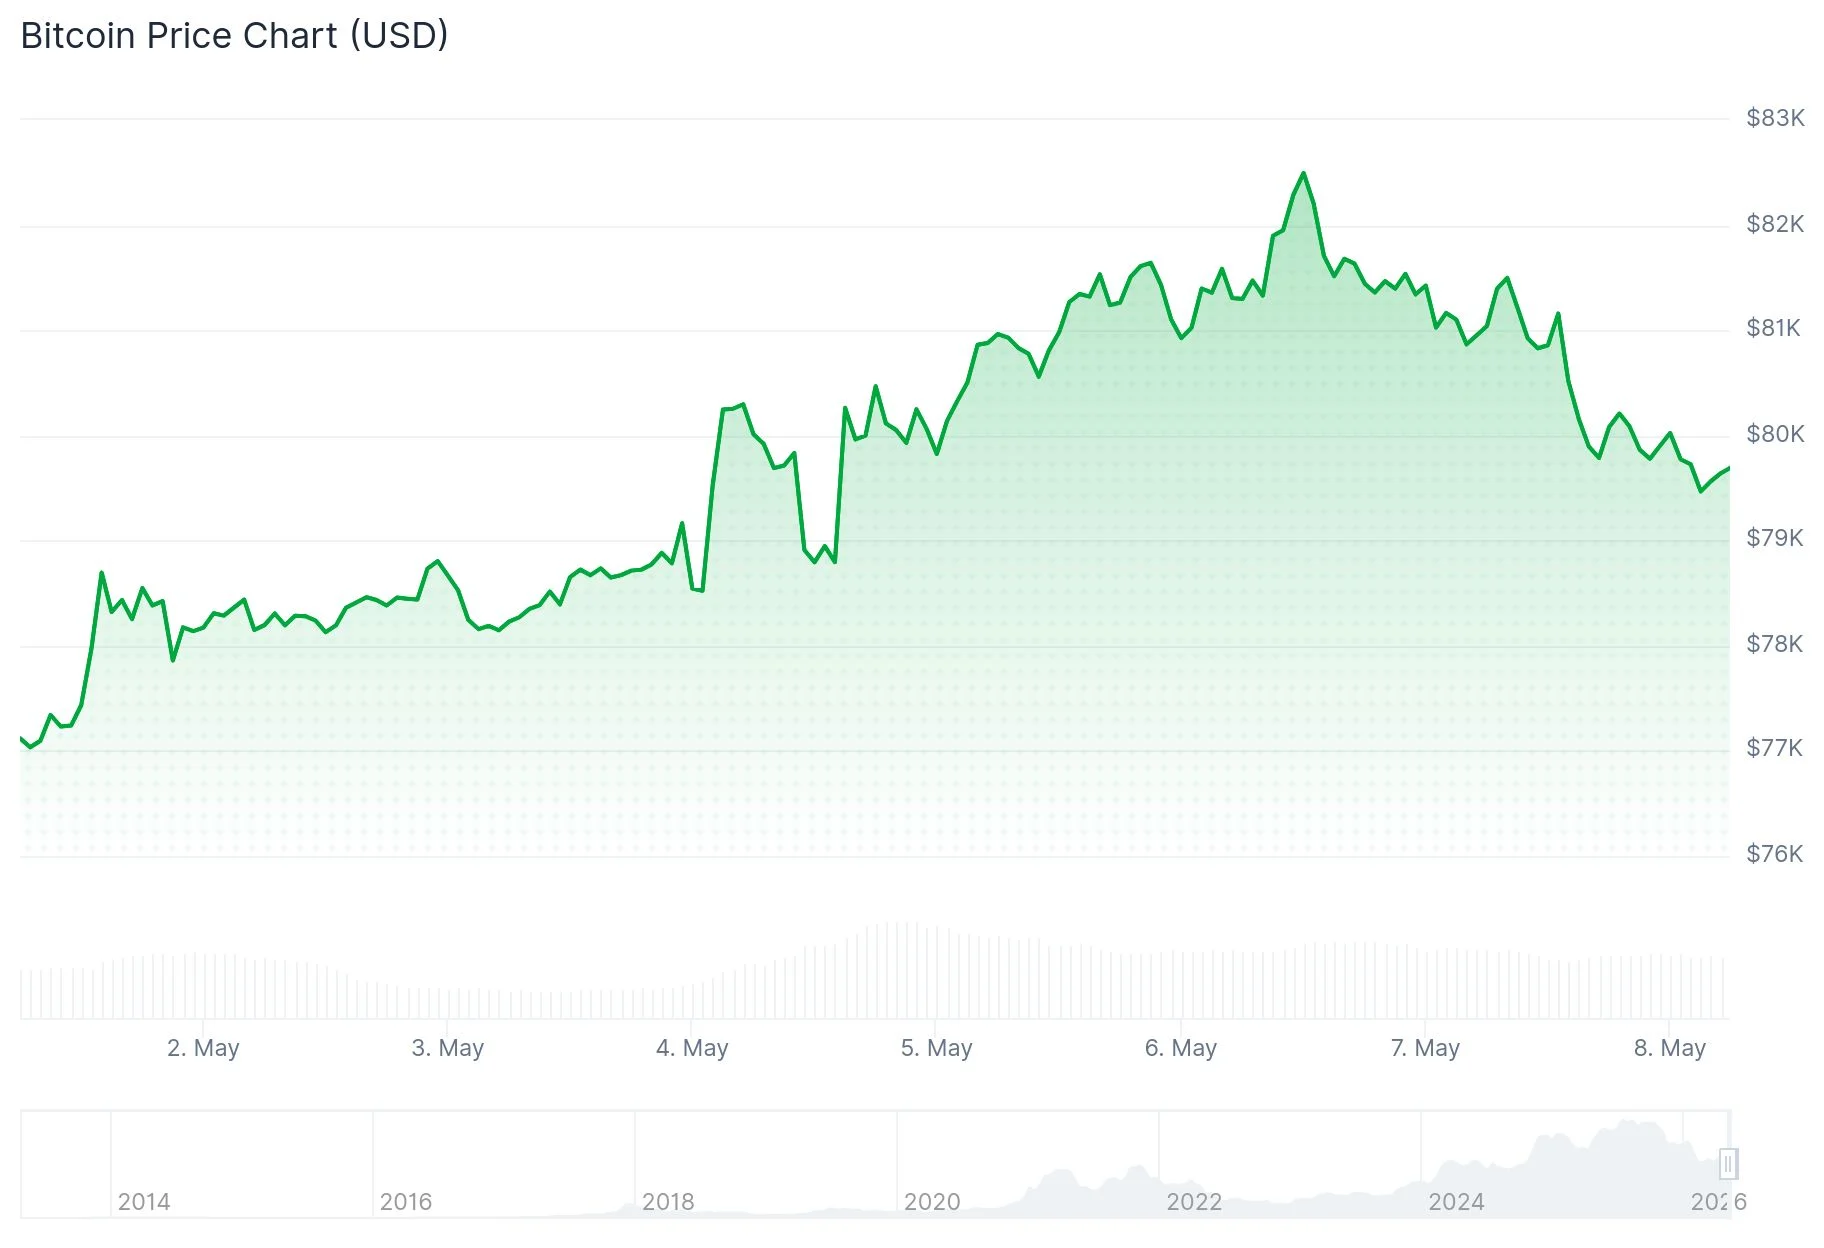
- BTC encountered resistance at $82,800 before retreating to $79,800 on Thursday
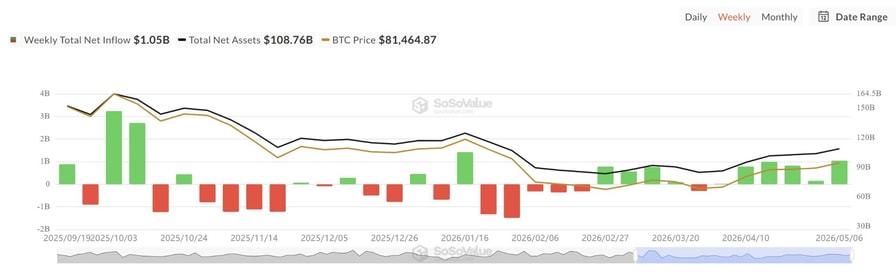
- Spot Bitcoin ETF inflows for the week reached $1.105 billion — the strongest performance since January
- Critical support zone identified between $76,000–$78,000, coinciding with the 200-day EMA
- Analyst Ali Charts highlights $80,300 as a pivotal whale cost basis threshold
- Glassnode pinpoints $85,200 as the subsequent major resistance barrier
Bitcoin slipped beneath the $80,000 threshold on Thursday following a rejection at the $82,800 resistance level, declining to an intraday low of $79,800. This downward movement occurred despite a robust week of exchange-traded fund inflows that exceeded $1 billion for the first occasion since January.
Technical indicators revealed bearish divergences across the one-hour and four-hour RSI timeframes, suggesting diminishing bullish momentum. Such divergences emerge when price action establishes higher peaks while the RSI indicator trends downward — an indication that upward momentum may be weakening.
Cryptocurrency analyst Jelle noted the 200-day moving average and EMA cluster functioning as resistance barriers, pinpointing $78,000 as the initial significant support threshold. Meanwhile, trader Killa XBT identified a more substantial support band spanning $76,300 to $74,700 should bearish pressure intensify.
The weekly opening price of $78,500 serves as the crucial near-term level that bulls are attempting to hold. Should this level fail, the daily fair value gap situated between $76,000 and $78,000 corresponds with the 200-day EMA and constitutes a probable retest area.
Understanding the $80,300 Whale Threshold
Market analyst Ali Charts emphasized $80,300 as the most significant price level requiring attention currently. This figure corresponds to the average acquisition cost for recent whale accumulations — large holders who purchased Bitcoin within the past 155 days.

When Bitcoin transactions occur below $80,300, these whale entities experience unrealized losses. BTC momentarily advanced to $82,800 before declining back beneath this threshold. Sustained trading below $80,300 could prompt these whales to liquidate positions at breakeven, potentially amplifying downward momentum.
Spot Bitcoin ETF products documented five consecutive trading sessions of net positive inflows through Wednesday, accumulating $1.69 billion — representing the longest inflow sequence since July 2025. Wednesday’s session alone contributed $46.3 million in fresh capital.
Glassnode analytics confirmed that Bitcoin has successfully surpassed two essential onchain benchmarks: the True Market Mean positioned at $78,200 and the Short-Term Holder Cost Basis at $79,100. Trading above both metrics places the majority of active market participants in profitable territory.
ETF Capital Flows and the Path Toward $85,200
Analysis from Swissblock indicates the Bitcoin Risk Index has normalized near zero, with ETF net flows registering positive at approximately 3,000 BTC. Swissblock researchers stated, “ETF demand is counterbalancing selling pressure. This continues to be a flow-driven breakout scenario.”
Data from Santiment revealed Bitcoin’s wallet holder count decreased by 245,000 addresses over five days — marking the fastest contraction in nearly 24 months. Santiment researchers observed this pattern resembles a June–July 2024 scenario when over 964,000 wallets exited before a substantial bullish surge materialized.
Perpetual futures funding rates continue displaying negative values despite a 26% rebound from February’s bottom levels, indicating short position holders remain engaged. Glassnode analysis shows long-term holders are crystallizing approximately $180 million daily in realized profits — characterized as measured rather than aggressive distribution.
Glassnode’s subsequent upside target sits at the Active Realized Price of $85,200, which monitors the cost basis for all actively circulating supply. This level represents where intensified overhead selling resistance is anticipated to emerge.
Bitcoin was exchanging just below $80,000 during Thursday’s U.S. trading session. Glassnode analysts emphasized that a sustained breakthrough above $85,200, supported by persistent spot market demand, is essential to validate that the recovery possesses fundamental strength.
Get 3 Free Stock Ebooks
Discover top-performing stocks in AI, Crypto, and Technology with expert analysis.
- Top 10 AI Stocks - Leading AI companies
- Top 10 Crypto Stocks - Blockchain leaders
- Top 10 Tech Stocks - Tech giants


