
 Reclaims $64K Amid US-Iran Diplomatic Developments in Switzerland")
Key Takeaways
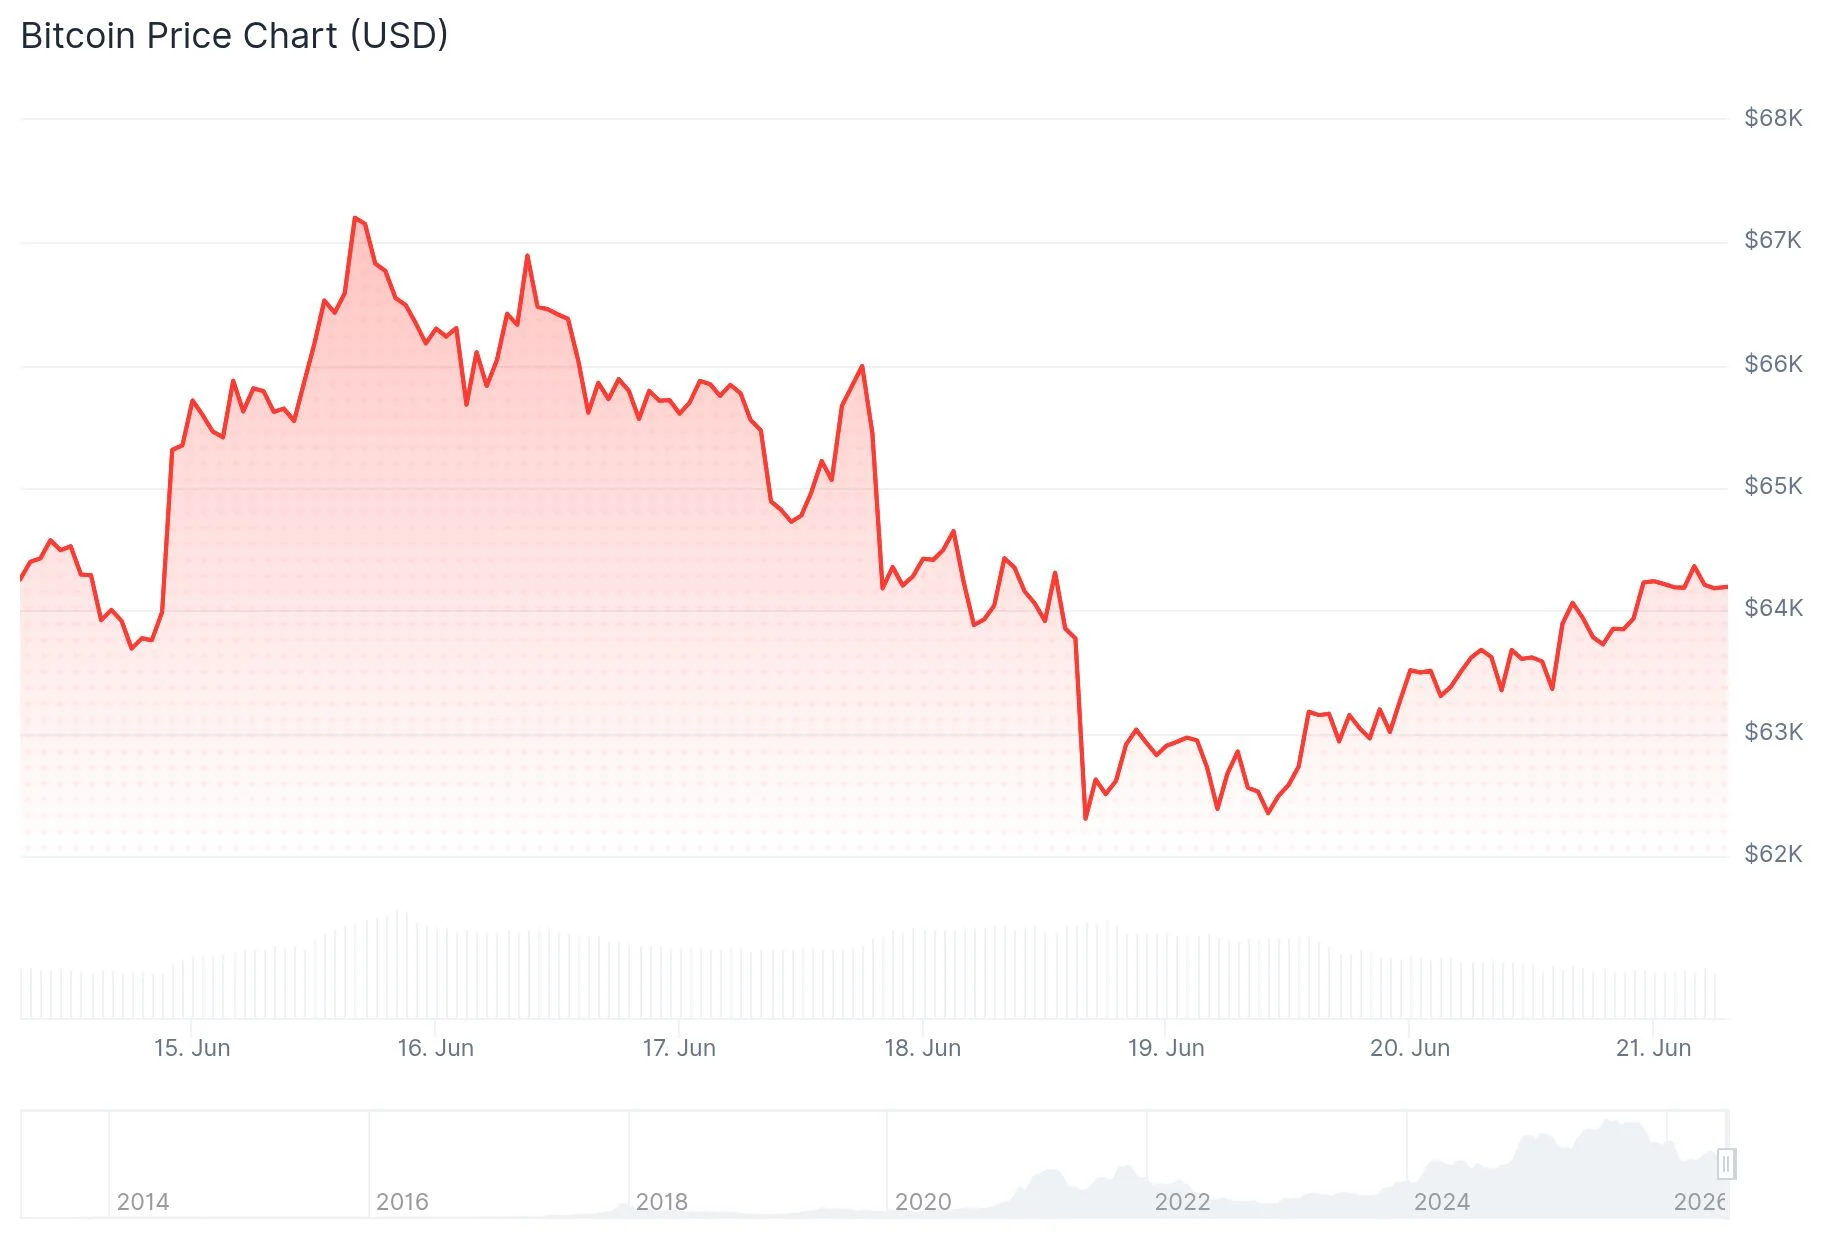
- Bitcoin surged past $64,000 on Saturday, June 20, marking a significant recovery
- The rally coincided with Vice President JD Vance’s announcement of travel to Switzerland for diplomatic discussions with Iran
- BTC maintains position above the critical 200-week simple moving average
- Market analyst SuperBro identifies striking similarities between current conditions and Bitcoin’s 2015 bottom pattern
- Critical resistance zone established at $63,800–$64,000, with crucial support level at $61,650
Bitcoin staged a notable recovery above the $64,000 threshold on Saturday, June 20, following announcements that US Vice President JD Vance would travel to Switzerland for renewed diplomatic engagement with Iran. The leading cryptocurrency was changing hands at $64,107, representing a 1.63% intraday gain.
In a statement to Fox News, Vance indicated his departure would occur “sometime the next couple of days” to join US representatives Jared Kushner and Steve Witkoff, both already positioned in Switzerland. Sources indicate Qatar and Pakistan are facilitating the diplomatic coordination.
The recovery comes after a week characterized by market volatility and diplomatic uncertainty. Initial reports suggested negotiations had reached an impasse, with a planned Friday meeting being delayed. Nevertheless, confirmation from major news organizations including CNN and Axios verified that Witkoff was en route to Switzerland to reinitiate the dialogue.
Market analyst Daan Crypto Trades highlighted on X that BTC was rebounding precisely from the Weekly 200-day moving average convergent with the 0.618 Fibonacci retracement zone. According to his analysis, maintaining the approximately $62K level through the weekly close remains essential for bulls, cautioning that failure to hold this threshold would signal short-term bearish momentum. He projected that breaking above the local peak near $67K could catalyze an advance toward $73K.
Technical Analysis and Historical Parallels
On June 19, technical strategist SuperBro drew attention to remarkable parallels between Bitcoin’s present price configuration and the foundational bottom established in 2015. Currently, BTC trades approximately 5% above its February nadir while maintaining elevation above the 200-week SMA.

SuperBro identified multiple bullish technical indicators: a constructive 10/20 SMA weekly crossover, Stochastic RSI advancing beyond 99, RSI transitioning from sub-30 territory to above 45, and an uninterrupted sequence of six weekly higher lows. He observed that the present retracement measures less than 2% from the previous low, mirroring 2015 market dynamics.
However, he emphasized that the 200-week SMA constitutes the decisive technical threshold. Sustained trading above this level preserves reversal potential, while a breakdown would significantly complicate recovery prospects.
Critical Price Zones Under Surveillance
Trader EliZ provided precise definition of Bitcoin’s immediate trading boundaries. The primary resistance barrier spans $63,800–$64,000, while fundamental support anchors at $61,650. According to his assessment, no compelling trade configuration currently exists, with the next substantial directional move contingent upon which boundary fails first.
He further outlined a potential scenario involving a temporary decline into the lower support region to capture liquidity, followed by a recovery if buying pressure resurfaces.
As of publication, BTC was quoted at $63,552 with 24-hour trading volume reaching $27.59 billion and market capitalization standing at $1.27 trillion, reflecting a 1.69% gain over the preceding 24-hour period.
Get 3 Free Stock Ebooks
Discover top-performing stocks in AI, Crypto, and Technology with expert analysis.
- Top 10 AI Stocks - Leading AI companies
- Top 10 Crypto Stocks - Blockchain leaders
- Top 10 Tech Stocks - Tech giants


