
 Price Maintains $70K Support Following Iran Strike – Critical Levels to Monitor")
Quick Summary
- BTC is currently trading near $70,000, experiencing a 0.7% decline over 24 hours following U.S. military action on Iran’s Kharg Island
- Bitcoin secured a 4.2% weekly increase — marking its most robust seven-day performance since September 2025
- The resistance zone between $73,000 and $74,000 has successfully blocked Bitcoin advances four times within the past two weeks
- Institutional demand continues as spot Bitcoin ETF net inflows reached $1.9 billion across three weeks, including $1.34 billion in March
- Market participants await the Federal Reserve meeting scheduled for March 17–18 for potential rate policy signals
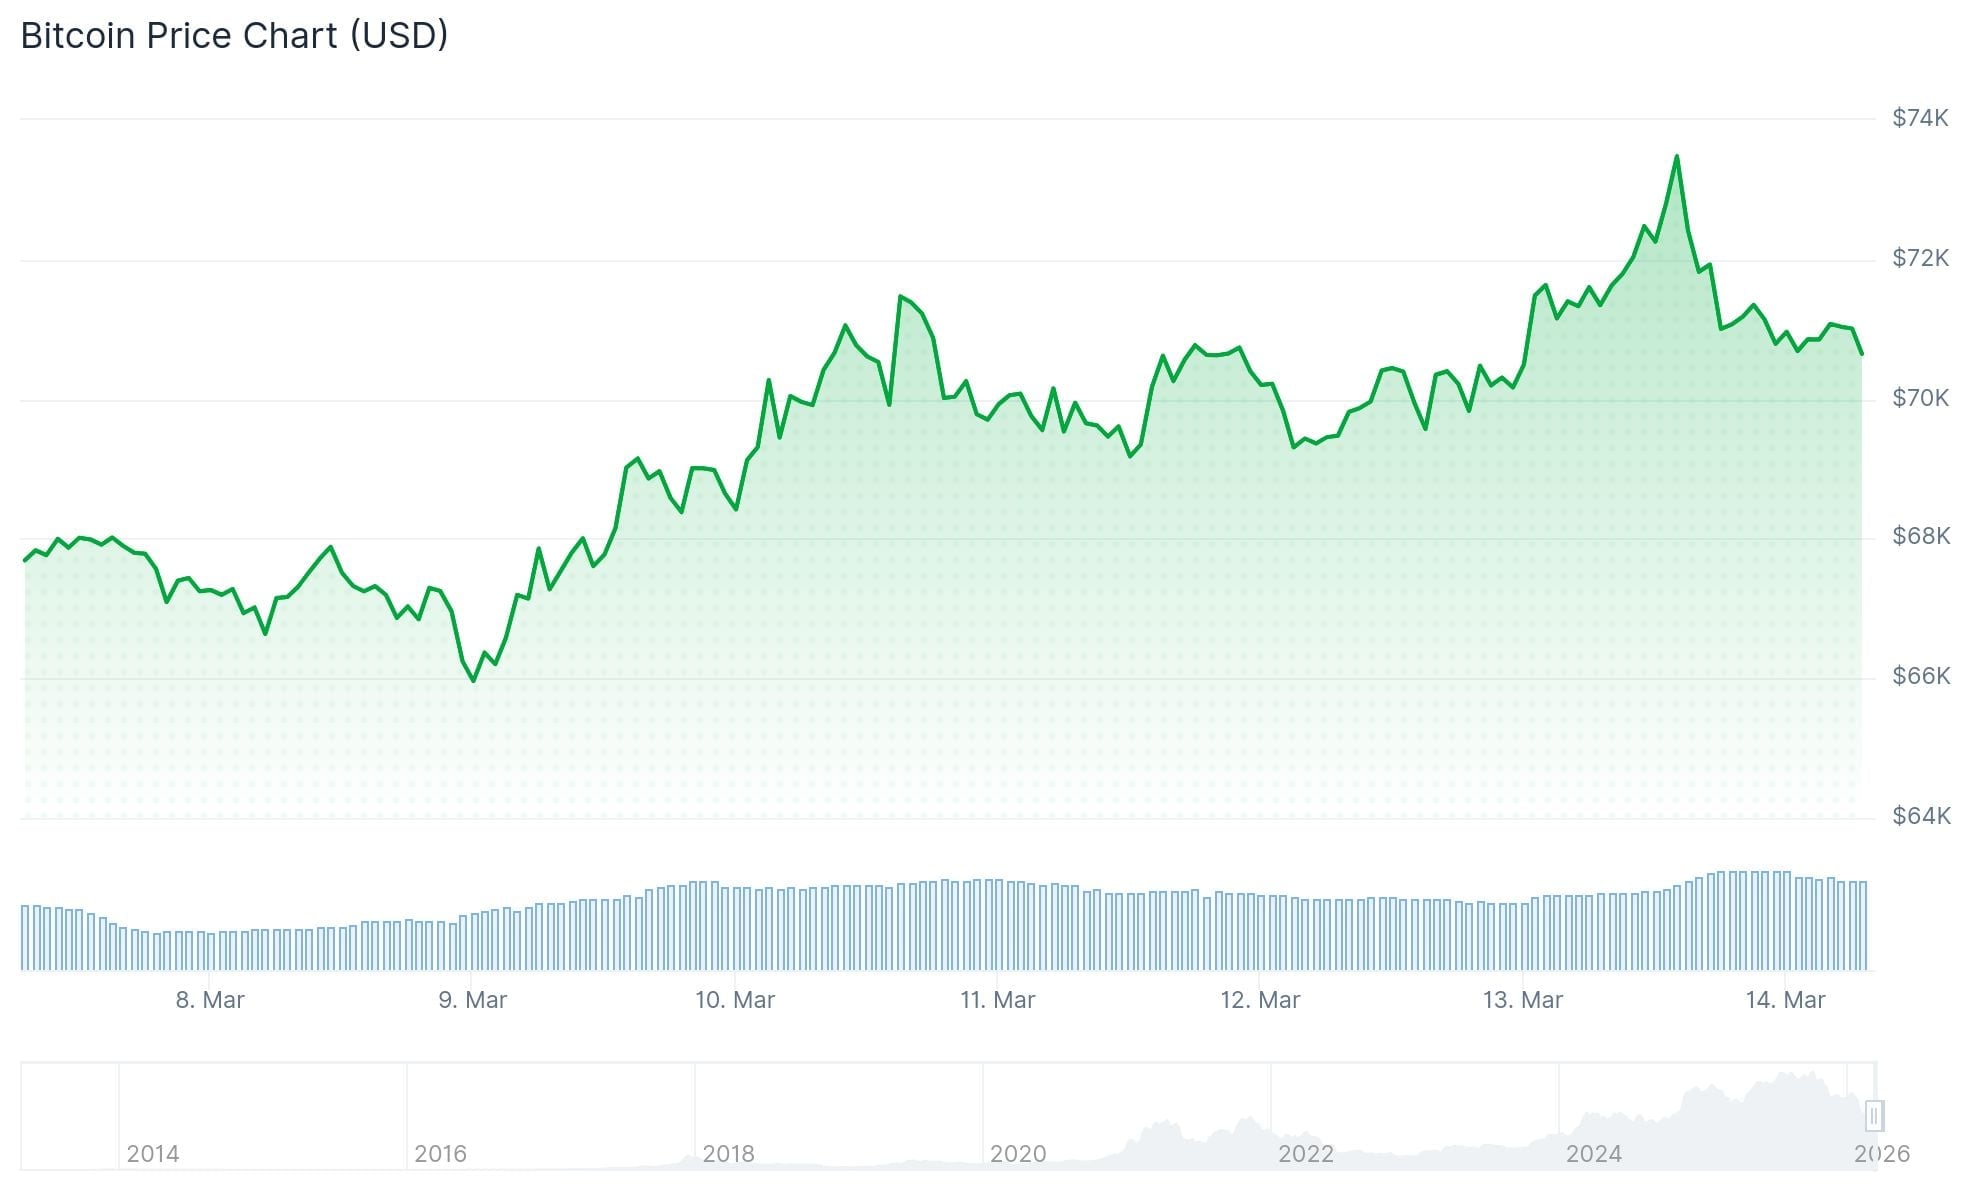
Bitcoin maintains its position around the $70,000 mark this Saturday, March 14, weathering heightened geopolitical uncertainty following U.S. military strikes on Kharg Island, Iran’s crucial oil export hub.
The leading cryptocurrency retreated 3.5% from Friday’s peak of $73,838 in the aftermath of the military action. While the decline was notable, it remained relatively controlled.
Two weeks since Middle East tensions escalated, Bitcoin’s price actually stands higher compared to pre-conflict levels.
Across the weekly timeframe, BTC registered a 4.2% gain. Ether climbed 5.5% to reach $2,090. Dogecoin advanced 5%. Solana increased 4.2% to $88. BNB posted a 4.5% rise to $655. The entire major cryptocurrency market closed the week in positive territory.
During the initial conflict phase, each news development triggered volatile swings in digital asset markets. However, market participants now seem to have adapted to a recognizable pattern: military strikes occur, crude oil prices surge, Bitcoin experiences temporary weakness — followed by price recovery.

This cycle has repeated sufficiently that immediate panic selling has diminished considerably.
Breaking Through the $73,000–$74,000 Barrier
Bitcoin has encountered rejection at the $73,000–$74,000 price band on four distinct occasions within the past fourteen days. This zone continues to represent the critical resistance barrier under market scrutiny.
Should BTC successfully establish support above $74,000, liquidation metrics indicate approximately $1.9 billion in leveraged long positions concentrated just beyond $75,000 — a region that may draw significant price movement.
Beyond that threshold, between $76,000 and $80,000, roughly $2 billion in sell-side liquidity is distributed throughout the $4,000 price range.
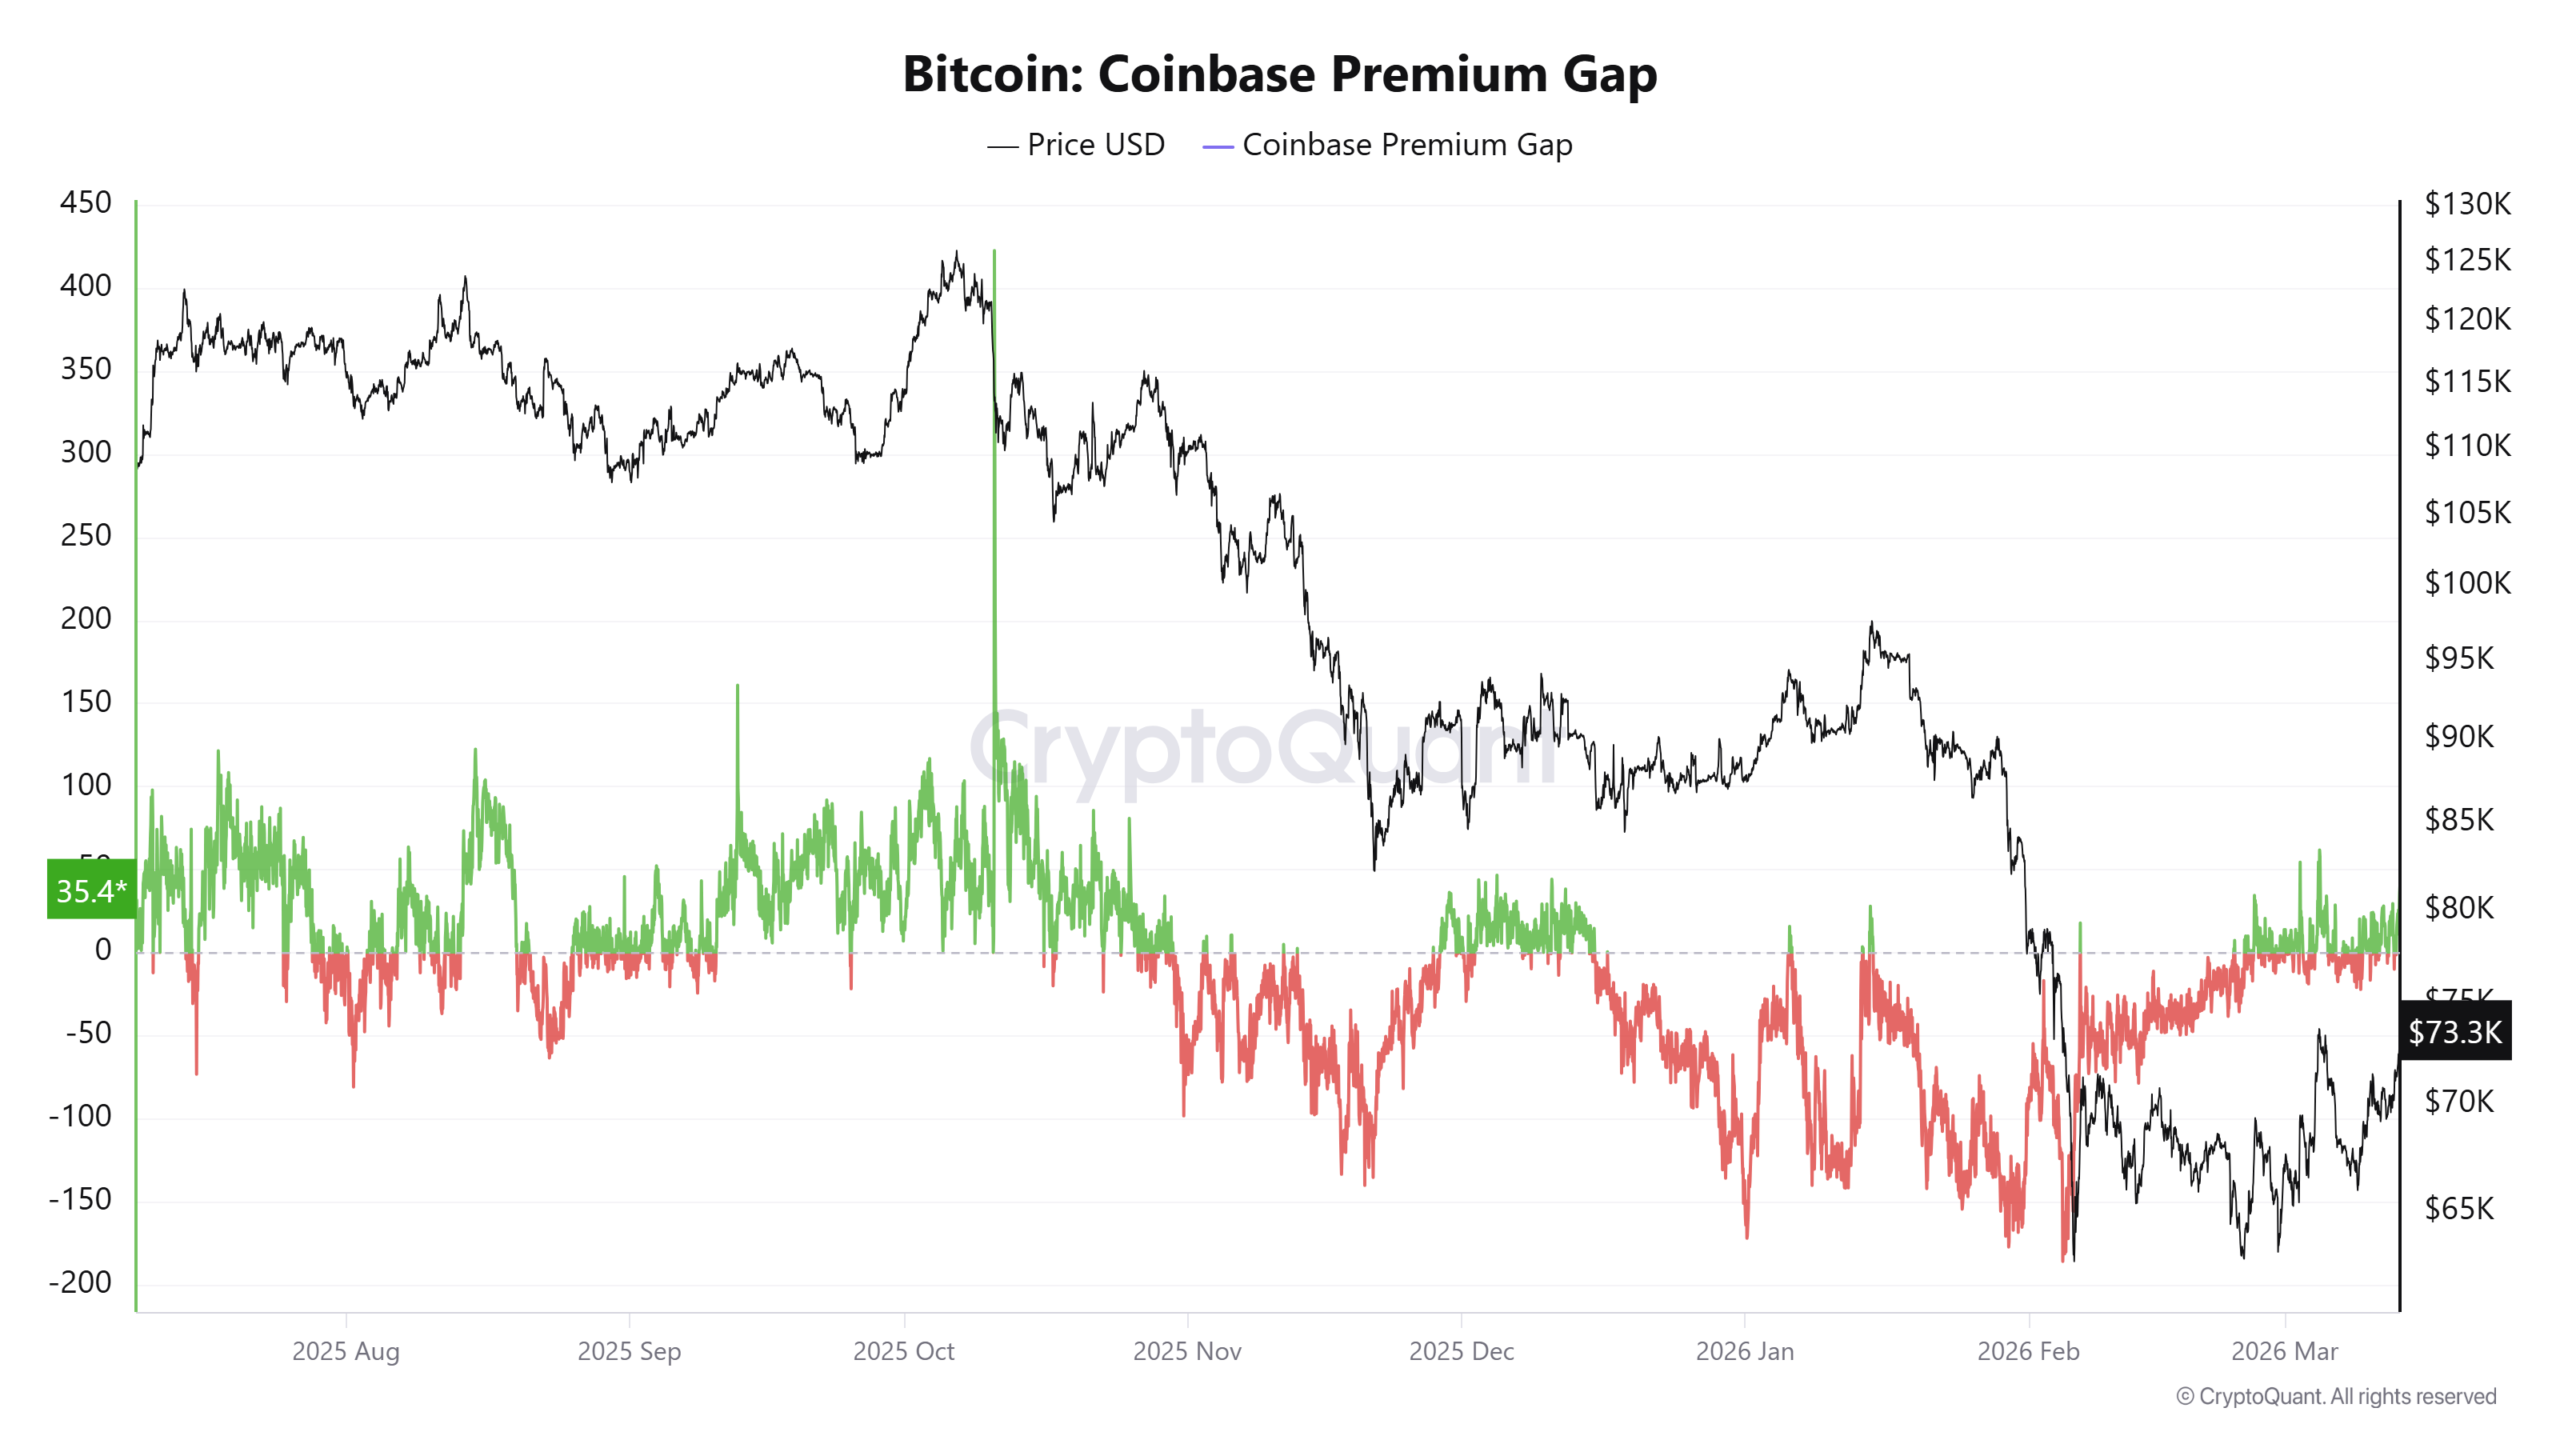
The Coinbase premium indicator flipped positive for the first instance in approximately ten weeks, registering +35.4. This development indicates increased buying activity from U.S.-based spot market participants, reversing a prolonged selling pattern observed throughout most of 2026.
Institutional Demand and ETF Capital Fuel Price Strength
Spot Bitcoin ETF net capital inflows have surpassed $1.9 billion throughout the previous three weeks. March has already recorded $1.34 billion in additions, positioning ETFs for their first positive monthly performance since October.
Strategy purchased 11,042 BTC during the week via its STRC financing initiative, contributing steady market demand.
The $371 million in aggregate liquidations recorded during the past 24 hours affected both market directions. Short position liquidations dominated at $207 million compared to $163 million in long positions.
Trump stated via Truth Social that he deliberately avoided targeting Iran’s oil infrastructure “for reasons of decency” but warned he would “immediately reconsider” should Iran persist in obstructing the Strait of Hormuz.
Iranian officials countered that any assault on energy assets would provoke retaliatory strikes against U.S.-connected installations throughout the region.
The Federal Reserve convenes March 17–18. CME FedWatch data indicates a 95%+ probability of maintaining current rates at 3.5%–3.75%, though market participants will closely analyze the dot plot projections and Powell’s press conference remarks for any indication of policy trajectory adjustments.
Get 3 Free Stock Ebooks
Discover top-performing stocks in AI, Crypto, and Technology with expert analysis.
- Top 10 AI Stocks - Leading AI companies
- Top 10 Crypto Stocks - Blockchain leaders
- Top 10 Tech Stocks - Tech giants


