
 Rallies From Key Support as Derivatives Activity Intensifies")
Key Highlights
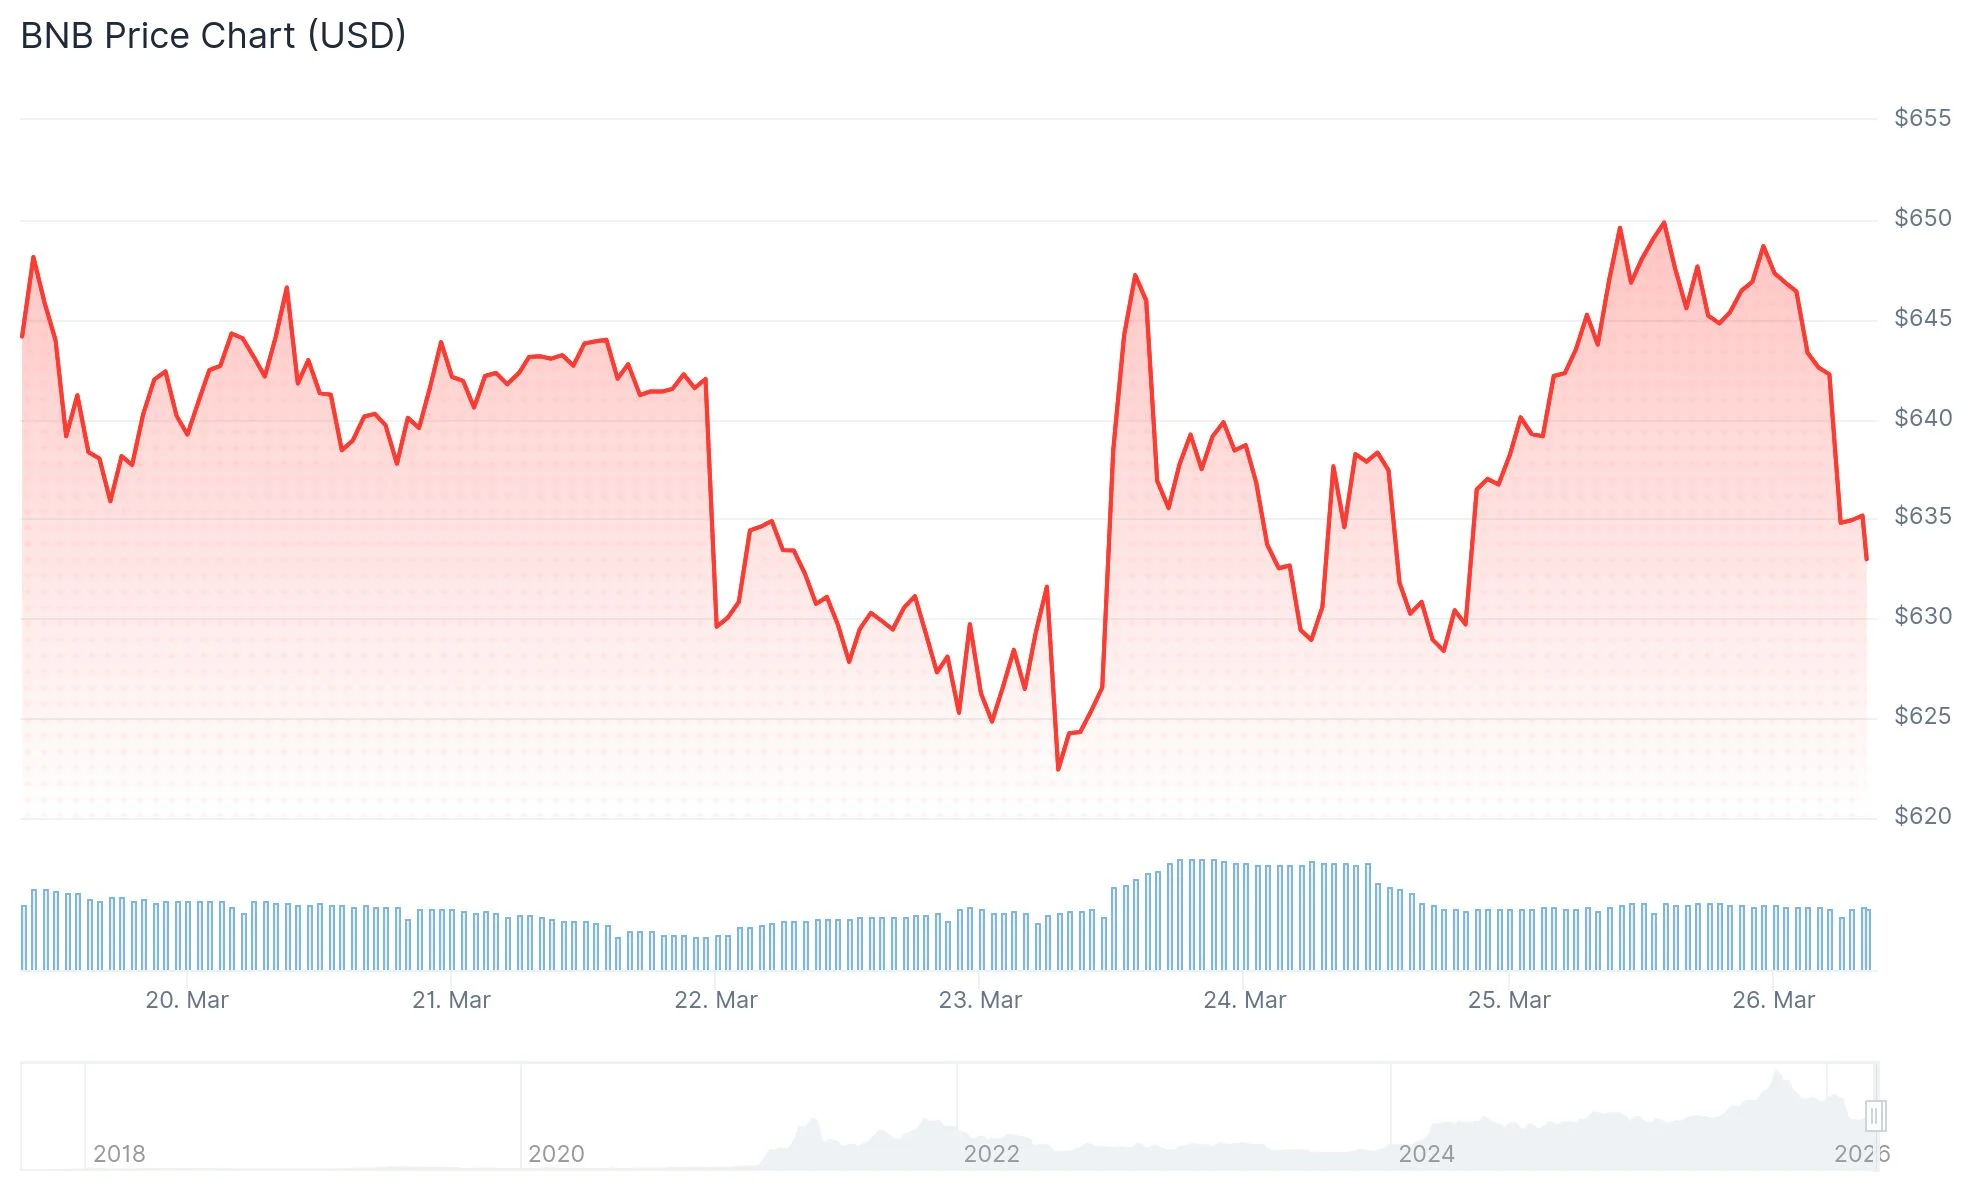
- Binance Coin recovered from $627 to approximately $648, driven by strengthening market conditions.
- Futures open interest climbed 6.5% to reach $923 million, while Binance’s long/short ratio exceeded 2.21.
- BNB maintains support above a critical ascending trendline and continues trading within a bullish channel formation on daily timeframes.
- A bullish crossover occurred as the 20-day SMA moved above the 50-day SMA, with BNB trading 53% under its peak price.
- Market analysts project price objectives ranging from $2,000 to $5,000, supported by cycle analysis and blockchain metrics.
Binance Coin reversed from weekend lows of $627 and recovered to approximately $648 by Monday, March 25. This upward movement coincided with improved risk appetite across crypto markets as U.S.-Iran tensions showed signs of de-escalation.
Crude oil retreated from the $100 mark to roughly $87 per barrel as geopolitical concerns eased. During this same window, Bitcoin surged past $71,000 while Ethereum neared $2,200. Equity markets across Asia, including the Nikkei 225, Hang Seng Index, and Shanghai Composite, recorded positive sessions.
According to CoinGlass derivatives data, open interest in BNB futures contracts expanded 6.5% over a 24-hour period to $923 million. On Binance specifically, the long/short ratio registered above 2.21, indicating that bullish positions significantly outnumber bearish ones among traders.
Technical Indicators Suggest Continued Strength
Binance Coin’s daily chart reveals price action contained within an ascending parallel channel structure. The token has successfully maintained support above the channel’s lower boundary, which has provided dynamic support across multiple tests in recent weeks.
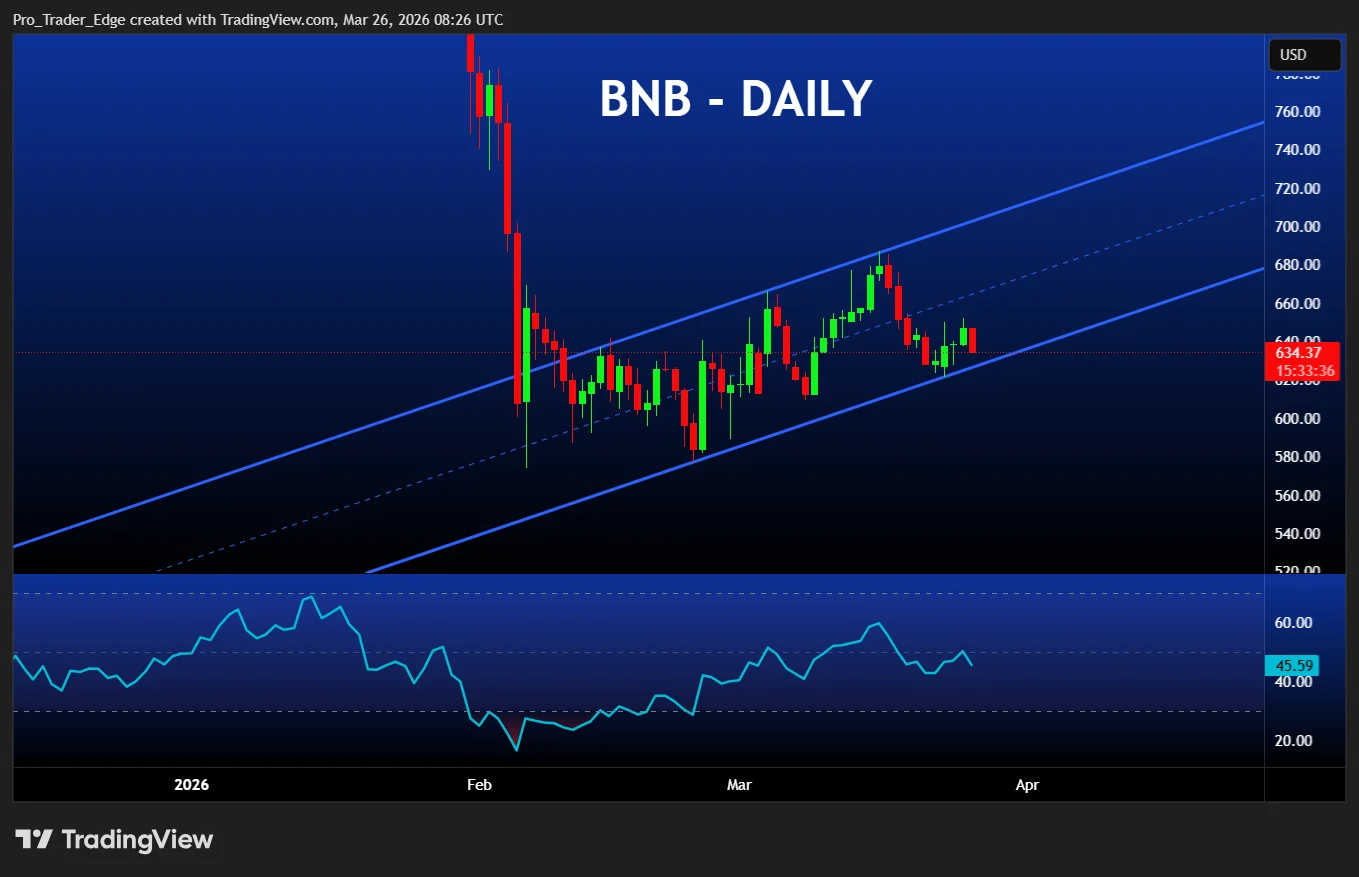
A notable development emerged as the 20-day simple moving average crossed above the 50-day SMA. This technical formation, commonly referred to as a golden cross, typically indicates strengthening short-term momentum favoring buyers. Meanwhile, the relative strength index (RSI) hovers near neutral territory, suggesting additional upside potential remains before overbought conditions emerge.

The immediate resistance barrier sits at $685, a price level that has previously capped rallies earlier this month. Successfully breaking through this threshold could pave the way toward the 100-day SMA positioned around $750. Conversely, a decline beneath $600 would challenge the current bullish technical structure.
With BNB currently positioned 53% below its historical peak, substantial recovery potential exists should favorable market conditions persist.
Crypto analyst Crypto Patel highlighted BNB’s 53% discount from all-time highs, emphasizing historical patterns, regular token burning mechanisms, and robust fundamental metrics as foundations for ambitious long-term price targets of $2,000, $5,000, and potentially $10,000, while identifying $300 to $420 as an optimal accumulation range.
Token Burns and Platform Utility Drive Underlying Strength
BNB maintains robust utility throughout the Binance ecosystem. The token serves multiple functions including settlement of transaction fees, enabling trading fee reductions, and powering various blockchain applications, which generates consistent organic demand.
Supply dynamics receive additional support from systematic token burn events. These regularly scheduled burns permanently remove tokens from circulation, progressively decreasing total supply. Market observers consider this deflationary mechanism a long-term price catalyst when combined with expanding network activity.
The previous accumulation range of $300 to $420 has been decisively reclaimed, and cycle-based analytical models now identify $2,000 to $5,000 as achievable targets. These forecasts draw upon historical price patterns and market structure analysis.
As of March 26, Binance Coin trades near $648 with the critical $600 support level remaining intact.
Get 3 Free Stock Ebooks
Discover top-performing stocks in AI, Crypto, and Technology with expert analysis.
- Top 10 AI Stocks - Leading AI companies
- Top 10 Crypto Stocks - Blockchain leaders
- Top 10 Tech Stocks - Tech giants


