
 Eyes $5,000 as Analyst Confirms Bull Flag Pattern Breakout")
Key Takeaways
- Crypto analyst Crypto Patel identifies a confirmed bull flag breakout on BNB’s higher timeframe charts, projecting a $5,000 long-term price objective.
- Following the breakout, the $600–$700 range has emerged as critical support territory.
- Additional support levels are identified in the mid-$500 range, while a more substantial accumulation opportunity exists near the low $400s.
- Technical indicators show RSI at 59, a bullish MACD configuration, and converging EMAs around $623, suggesting persistent upward momentum.
- Reaching the $5,000 projection relies on sustained ecosystem development, exchange market share, and favorable overall cryptocurrency market dynamics.
Binance Coin has captured market attention following prominent crypto analyst Crypto Patel’s identification of a bull flag breakout formation on the weekly timeframe, establishing a long-range price objective of $5,000.
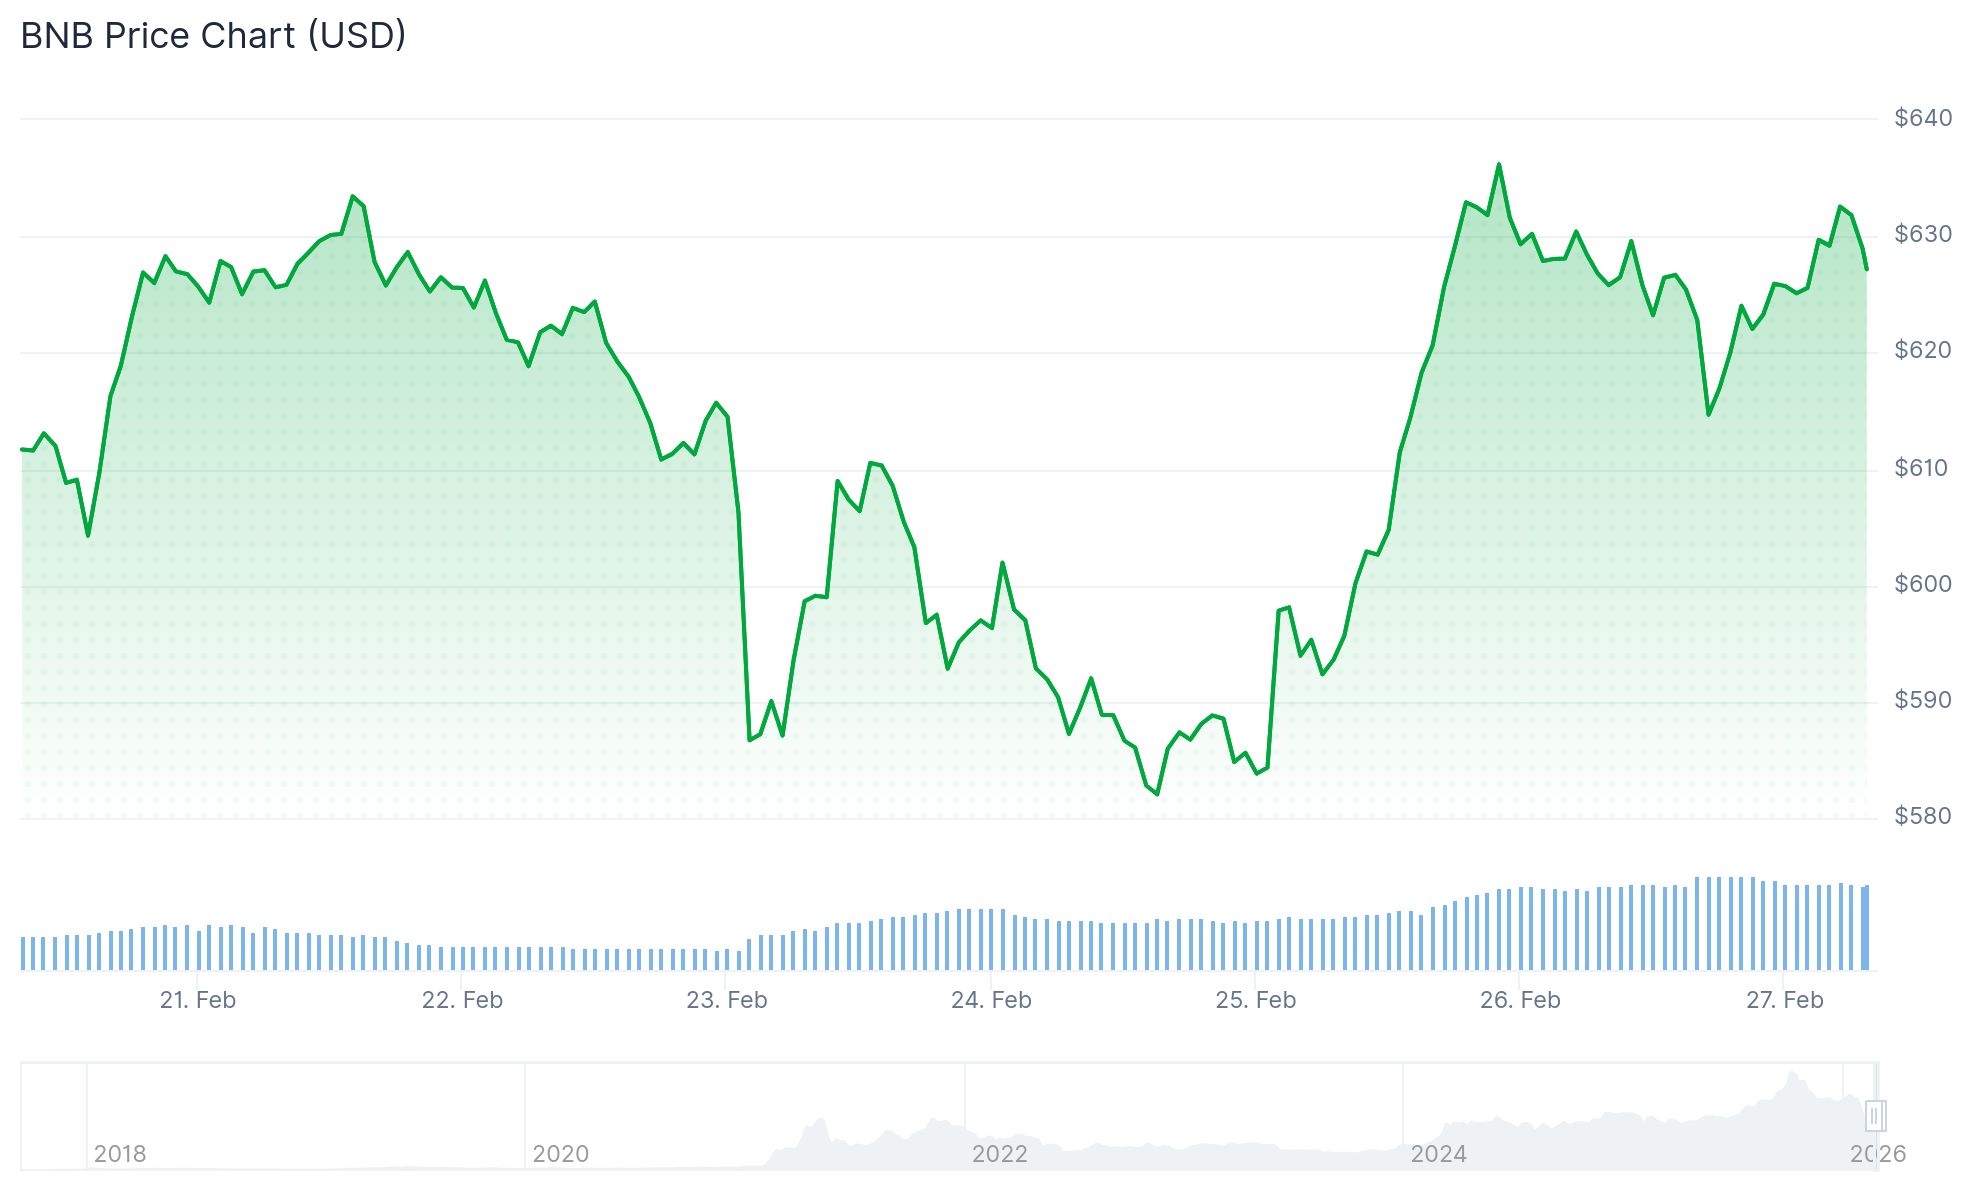
As of February 26, BNB was changing hands near $623, following a brief advance toward $640 before encountering resistance and retracing.
In technical analysis, a bull flag pattern emerges when an asset experiences a sharp upward move followed by a consolidation phase. When price breaks above this consolidation zone, technical analysts interpret it as a continuation signal for the existing uptrend.
Patel presented a weekly timeframe chart illustrating BNB’s escape from an extended compression phase that developed after its prior cycle peak. His analysis treats the move beyond this consolidation as pattern confirmation.
The $600–$700 territory has become a focal point for support monitoring. According to this technical assessment, the bullish thesis remains valid as long as BNB maintains trading activity above this critical zone.

Critical Support Zones Under the Microscope
Beneath the current trading level, technical charts reveal a support zone positioned in the mid-$500 region. Should a more significant retracement occur, BNB could decline toward what Patel identifies as an optimal “accumulation zone” situated near the low $400s.
Invalidating this bullish structure would require a sustained breakdown on higher timeframe analysis, which is not presently evident in current chart patterns.
Technical Indicator Analysis
Examining TradingView data, several key exponential moving averages — including the 20, 50, 100, and 200 periods — are clustering near the $623 level, establishing it as a pivotal zone for near-term support and resistance dynamics.
The Ichimoku Cloud indicator displays price action hovering just above the cloud formation, signaling tentatively bullish momentum. The Kijun and Tenkan lines are positioned beneath current price levels, offering support in the $615–$623 corridor.
The Relative Strength Index registers at 59, positioned above the neutral 50 threshold, indicating moderate bullish momentum. The RSI’s moving average displays an upward trajectory.
The MACD indicator shows its line above the signal line, with both components in positive territory. The histogram displays positive and expanding bars, demonstrating that buying pressure currently dominates market activity.
A sustained close above $623 could facilitate a move back toward the $630–$635 range. Conversely, a decline below $615 and the cloud structure may trigger downside movement toward the $608–$610 zone.
The ambitious $5,000 target represents a long-horizon projection contingent upon ecosystem expansion, exchange platform dominance, and favorable broader cryptocurrency market conditions — rather than a near-term trading opportunity.
As of February 27, BNB maintains its position above the $620 threshold with technical indicators continuing to support the prevailing bullish outlook.
Get 3 Free Stock Ebooks
Discover top-performing stocks in AI, Crypto, and Technology with expert analysis.
- Top 10 AI Stocks - Leading AI companies
- Top 10 Crypto Stocks - Blockchain leaders
- Top 10 Tech Stocks - Tech giants


