

TLDR
- Solana price is testing critical resistance at $190, signaling a potential breakout.
- Key support levels at $160 and $140 could provide buying opportunities in a pullback.
- A breakout above $190 could target $260, with $360 as a longer-term goal.
- Volume analysis will be crucial in confirming any breakout or potential failed move.
Solana (SOL) continues to gain attention as its price shows signs of movement. After consolidating for a while, key price levels are now in focus. Analysts are closely watching Solana’s resistance and support zones to determine the next direction. In this article, we dive into the technical factors that could drive Solana’s price in the coming days.
Solana Price Long-Term Potential and Target
Solana’s long-term outlook remains bullish. A breakout above $190 could open the door for further price increases. An initial target near $260 is realistic, with $360 as a longer-term goal if upward momentum continues.
In the medium term, maintaining momentum through key resistance levels is crucial for pushing toward the $360 target. However, as always, it’s important to remember that markets can be unpredictable
Solana Price and Technical Structure
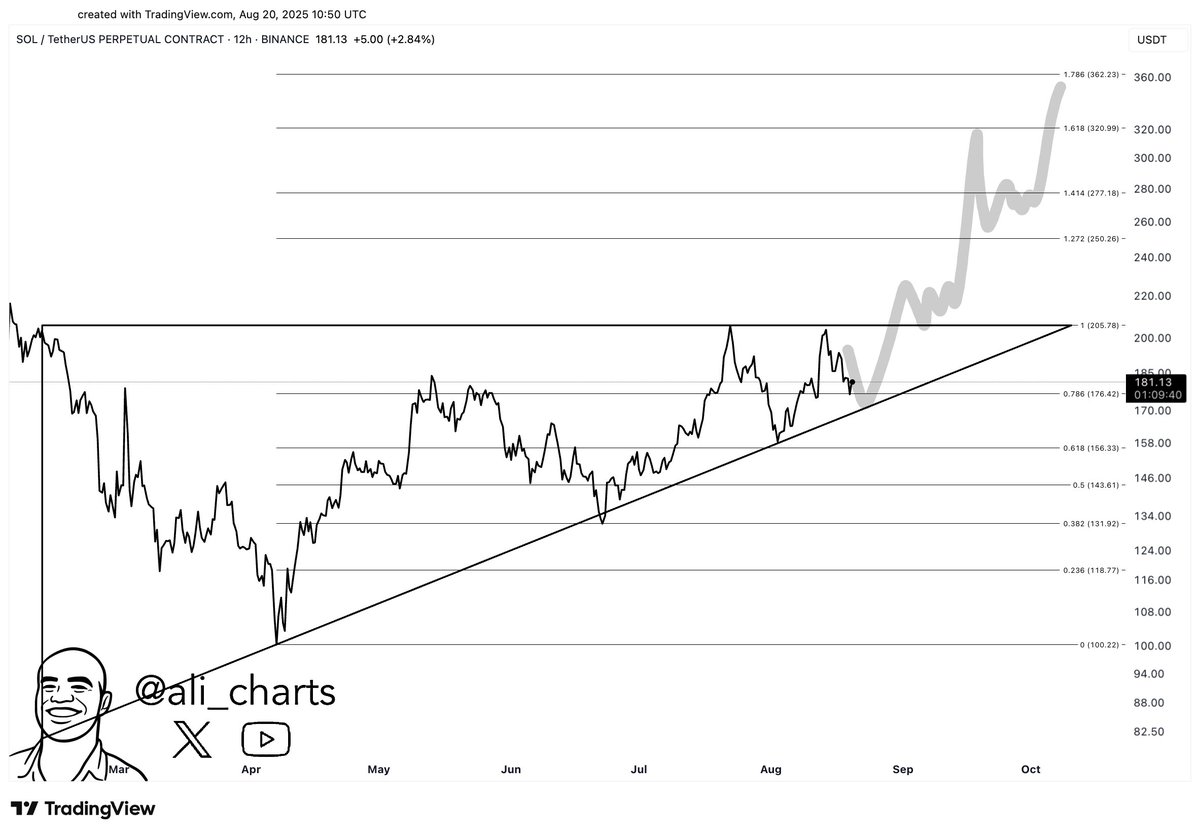
Furthermore, Solana’s chart currently displays an ascending triangle pattern, indicating a potential breakout. The price is confined by rising support and a horizontal resistance line, which suggests that Solana has built up strength. A breakout above $190 would confirm the bullish scenario, with a target around $260.
- SOL/TetherUS 12H Chart | Source: TradingView
However, if Solana fails to break above the $190 resistance, a pullback could occur. Key support levels near $160 and $140 are important, especially as they coincide with key Fibonacci retracement levels (0.382 and 0.618). These levels could present buying opportunities if the price moves lower.

Volume Analysis and Breakout Confirmation
Building on Technical structure, volume plays a critical role in confirming breakouts. If the price breaks above $190 and volume spikes, the chances of a sustained rally increase. Strong volume shows that buyers are actively participating, supporting a price increase.
On the other hand, low volume during a breakout could indicate a false move. Without significant volume, the price may fall back into the triangle pattern, invalidating the bullish outlook.
In addition, should Solana experience a pullback, the $160 and $140 levels are crucial support areas. These levels have historically held as strong support, offering potential buying zones. A fall below $140, however, would weaken the bullish case. If the price drops below these key levels the overall trend could shift.
Get 3 Free Stock Ebooks
Discover top-performing stocks in AI, Crypto, and Technology with expert analysis.
- Top 10 AI Stocks - Leading AI companies
- Top 10 Crypto Stocks - Blockchain leaders
- Top 10 Tech Stocks - Tech giants


