


TLDR
- LINK consolidates around $13.84 following a retreat from the $15 threshold
- An ascending support line established in August currently protects the low-$13 zone
- CCIP 2.0 protocol upgrade introduces enhanced security and faster cross-chain transaction capabilities
- Combined U.S. Chainlink ETFs manage approximately $235 million in assets, representing about 17 million tokens
- Technical analyst Don Wedge identifies a multi-year triangle formation projecting $67 upside potential
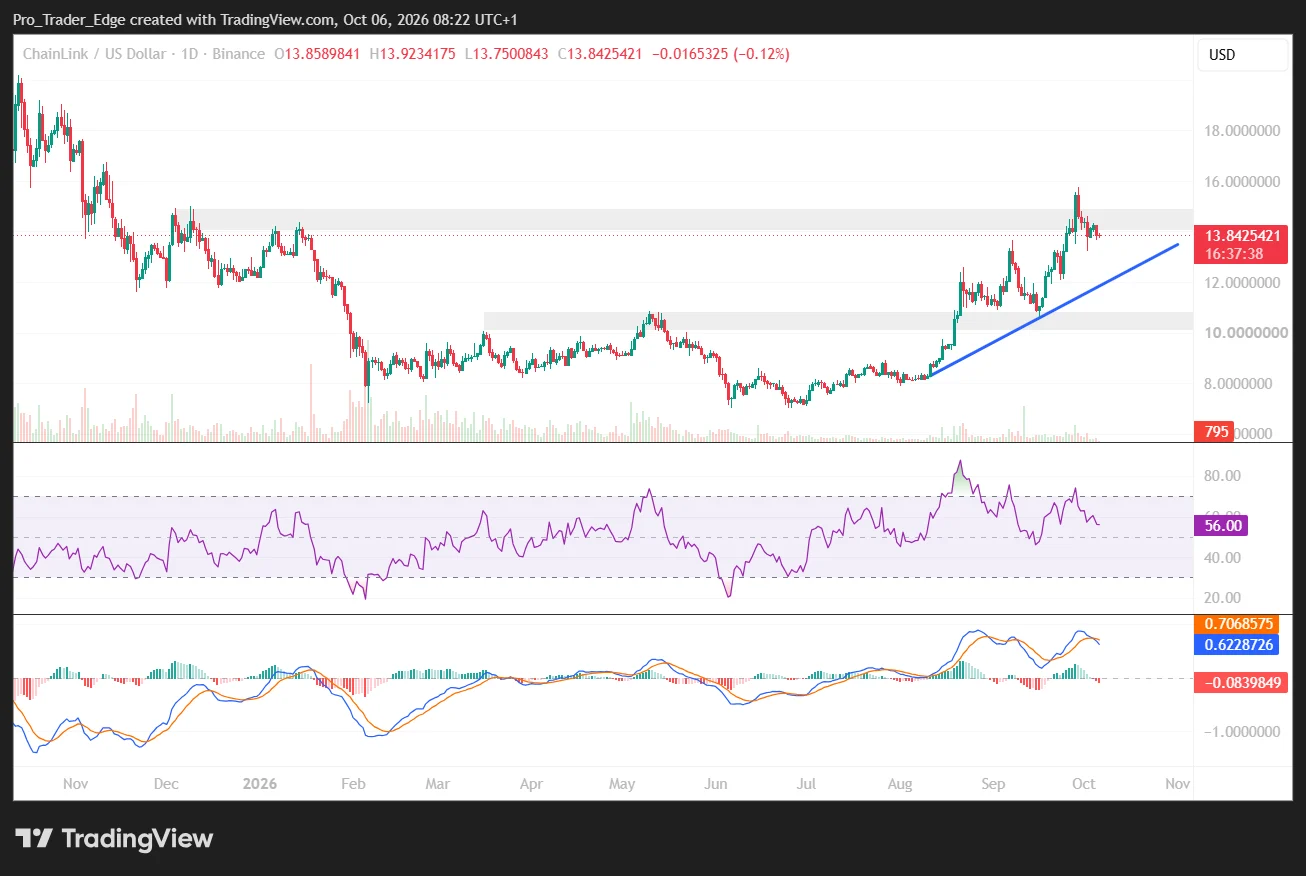
Chainlink (LINK) is currently consolidating near $13.84 following a rejection from resistance above the $15 level. Market participants continue to support the ascending trend that originated during August trading.
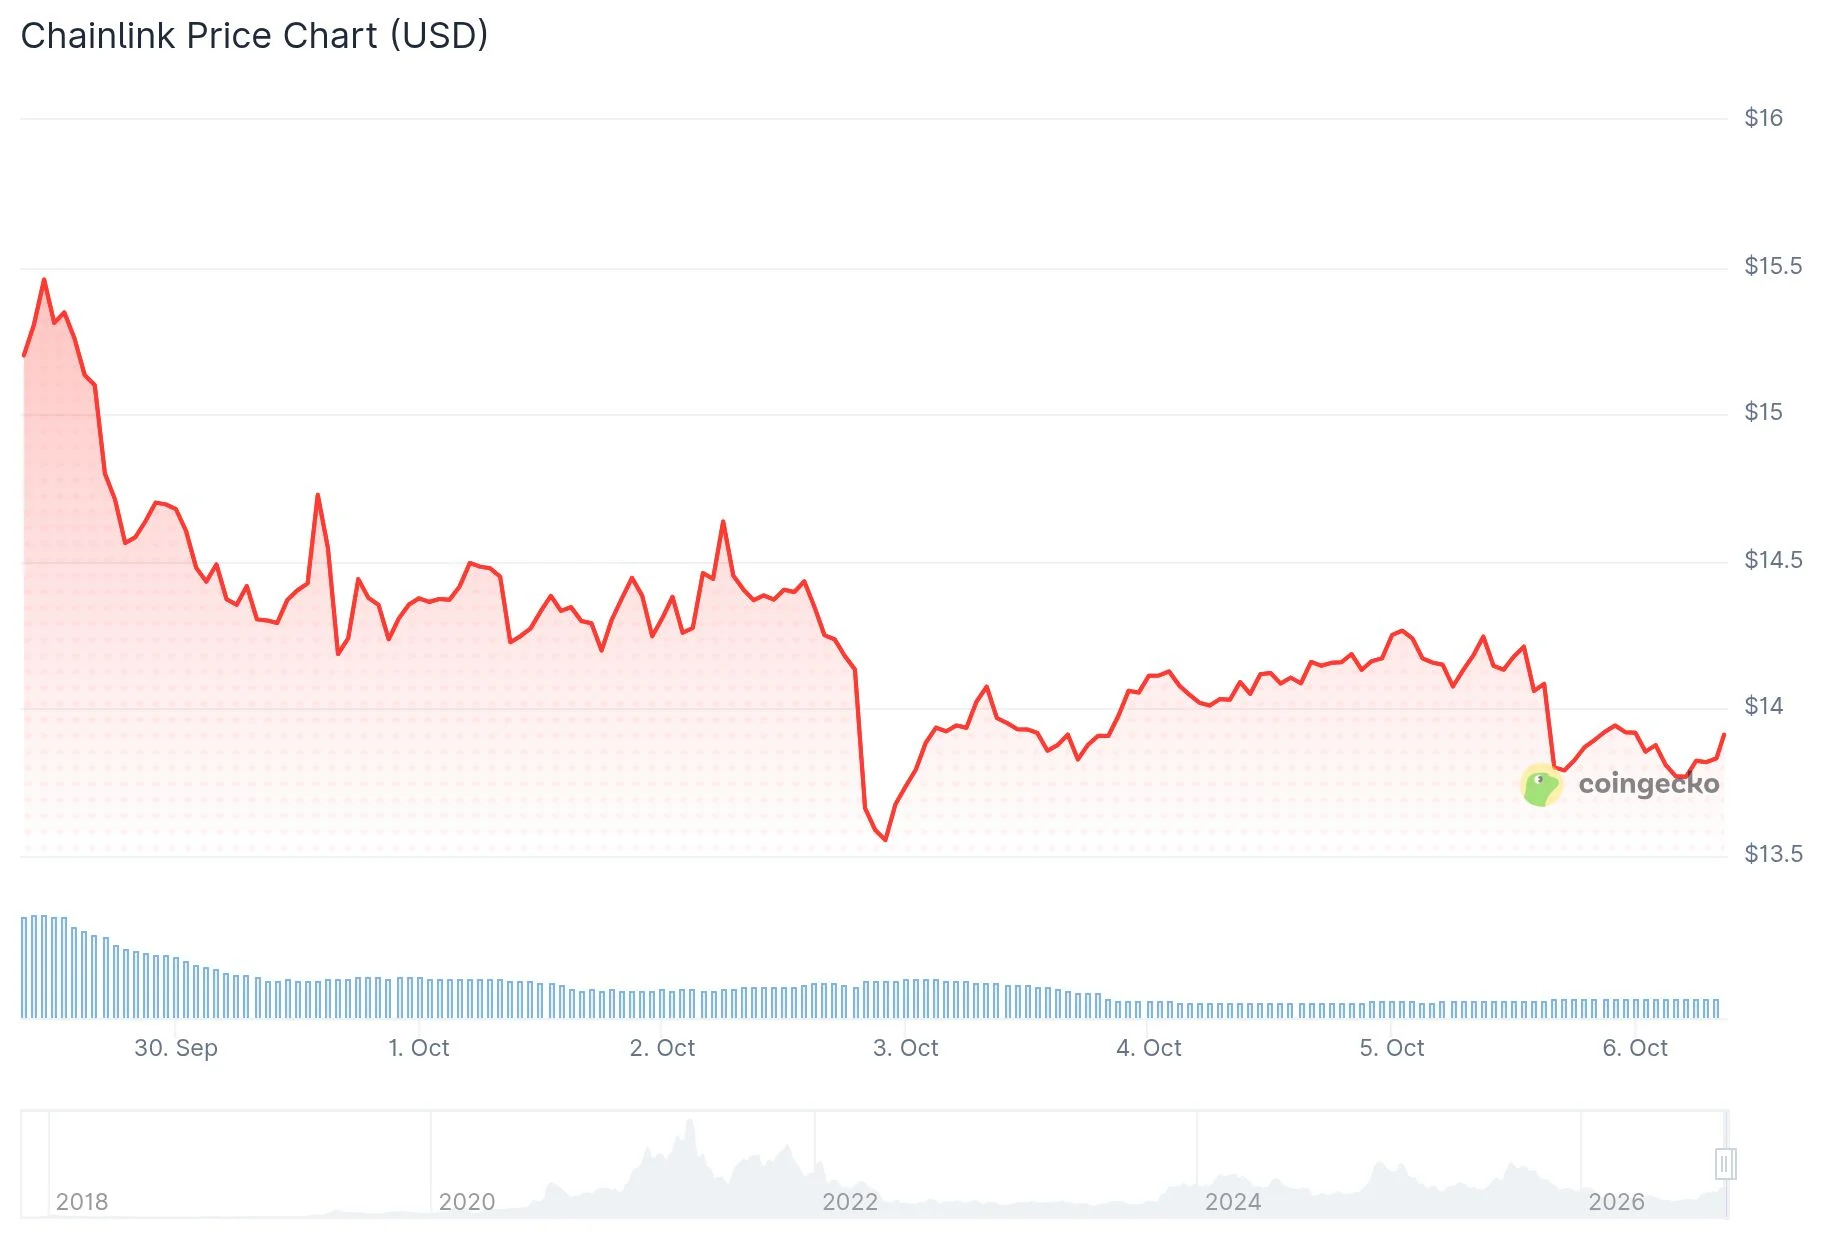
The token began October 6 trading near $13.86, reaching an intraday peak around $13.92. Daily performance showed minimal movement during the session.
Medium-term price action demonstrates significant improvement compared to summer conditions. After trading near $8 during August, LINK established a series of ascending lows throughout the subsequent rally.
The advance carried Chainlink beyond the $10-$11 price range, approaching a technical ceiling between $14.50 and $15.00.
Bulls confront critical $15 barrier
The $14.50-$15.00 region represents the most significant obstacle on current daily charts. LINK penetrated $15 momentarily during late September before facing selling pressure that forced a reversal.

A confirmed daily close above $15 would eliminate this overhead resistance and potentially enable progress toward $16. For downside scenarios, the upward-sloping trend line from August currently provides support near low-$13 levels and has successfully absorbed recent selling pressure.
Further below, the $10.30-$10.80 zone constitutes the primary support foundation, representing the same area LINK surpassed during its August breakout rally.
Price momentum has moderated but remains constructive. The Relative Strength Index on daily timeframes registers 56.00, positioned above the 50 midpoint while staying below overbought thresholds. MACD indicators display more caution, with the MACD line trading beneath its signal line accompanied by negative histogram values, suggesting diminished near-term momentum following the September rally attempt.
The network recently deployed CCIP 2.0, representing a significant protocol enhancement that introduces optional security mechanisms called Cross-Chain Verifiers. This functionality enables institutional participants to implement additional verification layers for cross-chain asset movements. The upgrade simultaneously introduces faster-than-finality transfer capabilities, providing users with enhanced control over transaction speed and confirmation parameters.
Chainlink’s data infrastructure continues expanding across blockchain ecosystems. Data Feeds became operational on Stellar’s network, while CCIP integration was completed on the Arc mainnet throughout September.
Regarding institutional adoption, Bitwise’s U.S.-listed Chainlink ETF has accumulated approximately $47 million in total net inflows, including $14 million during the most recent month. The fund experienced zero outflow days throughout that period.
The two monitored U.S. Chainlink investment vehicles collectively managed approximately $235 million as of October 5, equivalent to roughly 17 million LINK tokens. Grayscale’s product accounted for around $169 million of total holdings, with Bitwise’s CLNK fund contributing approximately $66 million.
Market analyst Don Wedge highlighted LINK’s extended timeframe chart architecture, identifying a five-year symmetrical triangle formation with ascending support originating from 2019 that recently provided a bounce. He designated $18.4 as the initial resistance level requiring a breakout, identifying it as the triangle’s descending upper boundary, and established a pattern target of $67 upon successful resolution. Wedge emphasized the pattern is approaching its apex convergence point, which typically forces directional resolution.
Chainlink maintains positioning near $13.84 while preserving its daily uptrend structure. Buyers must successfully defend the ascending trend line and recapture the $14.50-$15.00 resistance zone to enable the next upward phase.
Get 3 Free Stock Ebooks
Discover top-performing stocks in AI, Crypto, and Technology with expert analysis.
- Top 10 AI Stocks - Leading AI companies
- Top 10 Crypto Stocks - Blockchain leaders
- Top 10 Tech Stocks - Tech giants



