



Key Takeaways
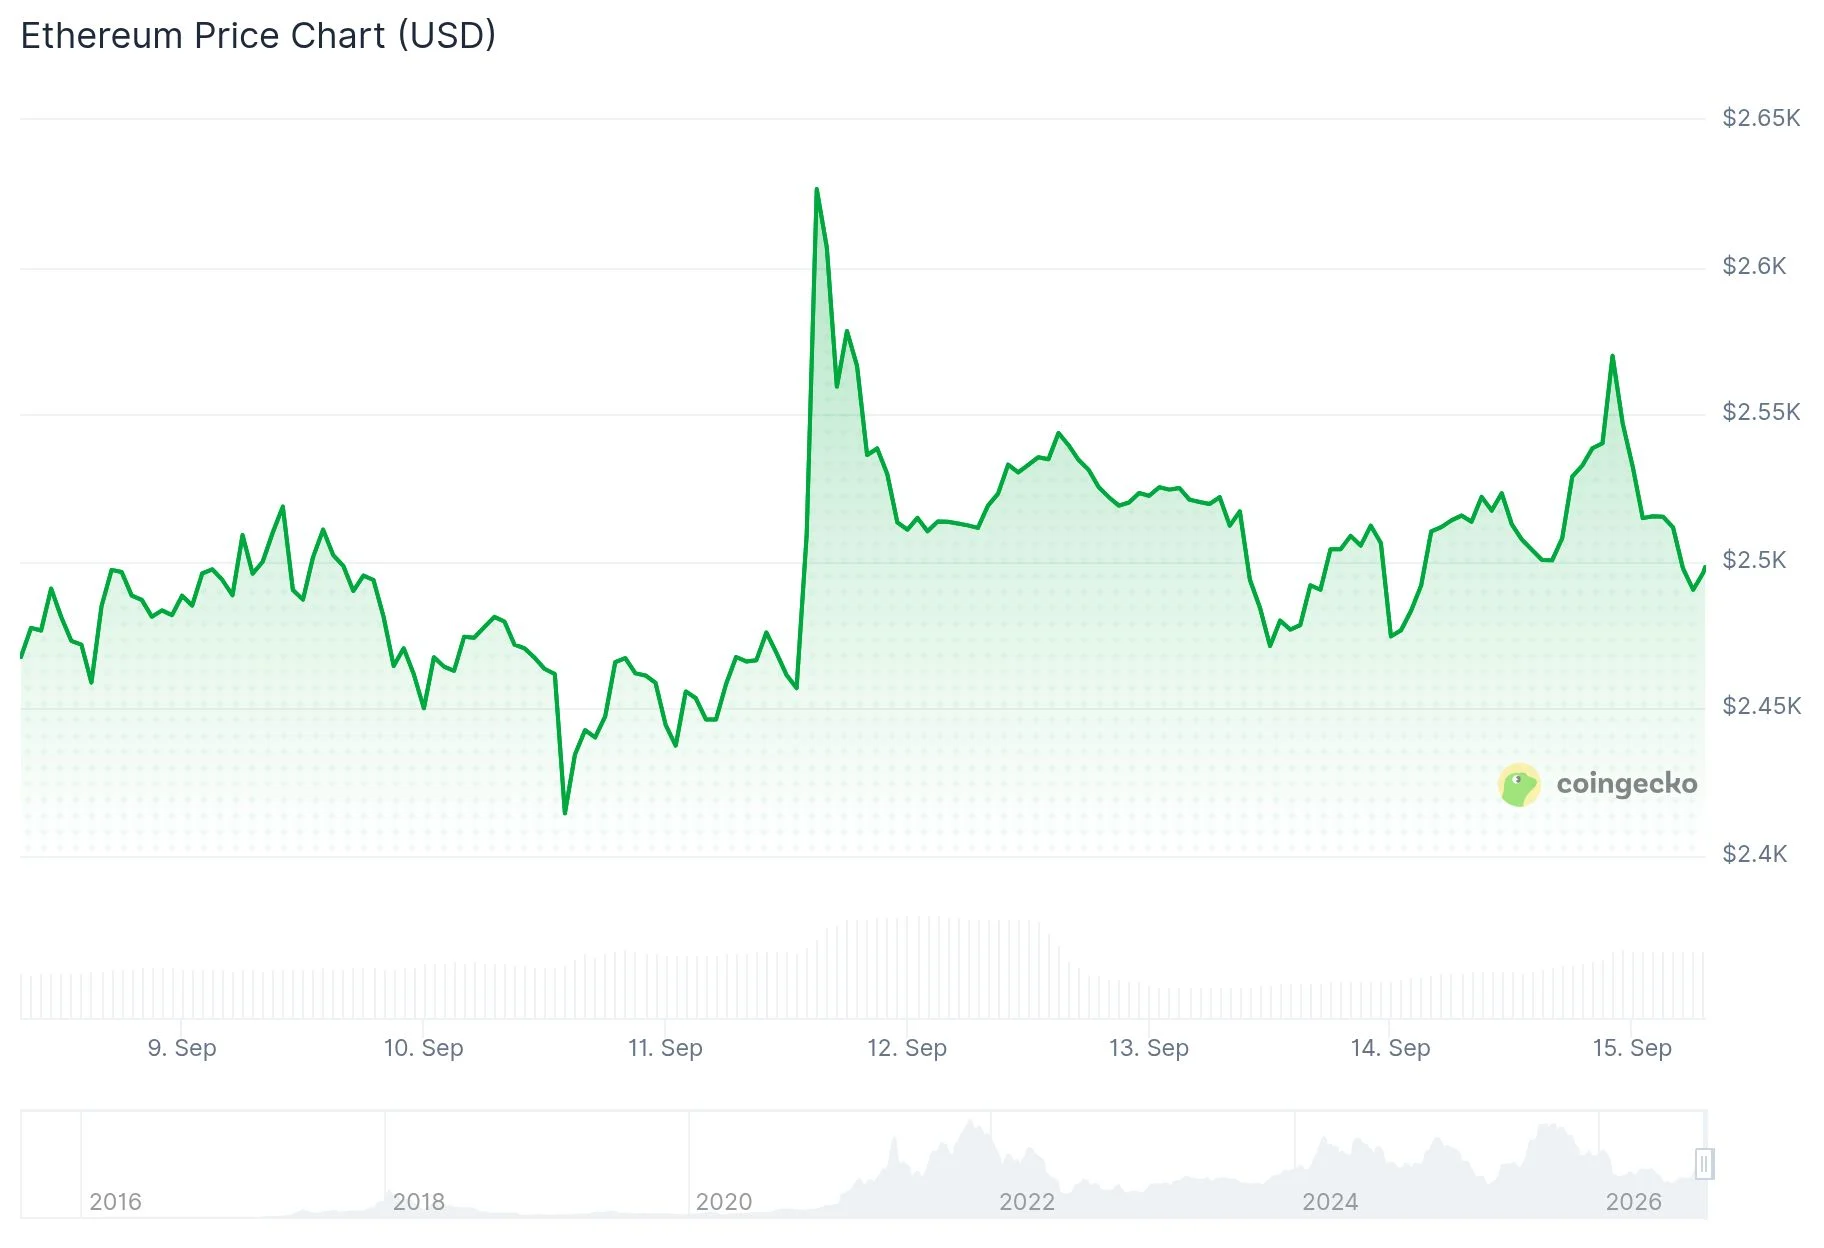
- ETH maintains position around $2,540 following a bounce back above the $2,500 support zone
- BitMine accumulated 27,180 ETH during the past week, expanding holdings to 5.95 million ETH total
- Spot Ethereum ETFs in the US recorded $197.1 million in net inflows, contrasting with $462.7 million in Bitcoin ETF outflows
- Tuesday’s procedural vote on the Clarity Act may catalyze increased DeFi activity across the Ethereum network
- Technical indicators show ETH’s 50-day and 200-day exponential moving averages nearing a golden cross formation
Ethereum continues to trade in the vicinity of $2,540 this Monday, successfully maintaining ground above the critical $2,500 support threshold following consistent upward momentum in recent trading sessions.
Digital asset company BitMine Immersion (BMNR) acquired 27,180 ETH during the previous week. This purchase expands the firm’s holdings to 5.95 million ETH, representing approximately 4.9% of Ethereum’s total circulating supply of 122 million tokens.
BitMine has deployed 5.067 million ETH through its Made in America Validator Network (MAVN) staking operations. The corporation anticipates this staking arrangement will generate $334 million in annual revenue.
Meanwhile, cryptocurrency mining hardware manufacturer Canaan pursued a contrasting strategy. The company liquidated its complete holding of 3,952 ETH, alongside 54 BTC, realizing $13.9 million. Canaan executed the sale at an average price of $2,400 per ETH, then allocated the funds toward repurchasing 13.6 million of its own American Depositary Shares.
Santiment Intelligence identified a notable shift in exchange supply dynamics. The analytics platform observed that ETH held on centralized exchanges has decreased to 6.06 million tokens, down significantly from the June 2020 peak of 22.9 million — representing a 73% reduction. Santiment emphasized that reduced exchange inventory translates to fewer coins available near active order books, potentially magnifying price volatility when buying momentum increases.

Institutional ETF Activity and Market Positioning
US-based spot Ethereum ETFs registered $197.1 million in net inflows throughout last week, while Bitcoin ETFs experienced $462.7 million in net outflows, based on SoSoValue tracking data.
BitMine Chairman Thomas Lee highlighted that the ETH/BTC ratio has climbed to its strongest level since January 30, characterizing it as an emerging uptrend. Lee credited Ethereum’s expanding role in institutional tokenization efforts and agentic artificial intelligence applications.
Bitfinex analysts present an alternative interpretation. They suggest substantial ETH ETF demand stems from “cash and carry” arbitrage strategies, where market participants utilize ETH ETF holdings as collateral for CME futures trading while generating yield. The team references a $255 million ETH short liquidation event on Friday as supporting evidence that recent price movements reflect tactical positioning rather than organic spot accumulation.
Clarity Act Vote Emerges as Potential Catalyst
Market analyst Ted Pillows observed on social platforms that ETH was unable to secure a weekly close above the $2,550 mark. He suggested that successful passage of the Clarity Act this week could enable ETH to recapture the $2,550 level, potentially initiating a rally toward $3,000.
A procedural vote regarding the Clarity Act is scheduled for Tuesday. The proposed legislation could facilitate expanded stablecoin integration and decentralized finance adoption throughout US markets. Prediction market Polymarket shows probability estimates for 2026 passage increasing from 14% to 31%.
The Federal Open Market Committee convenes this week as well. Approximately 87% of market analysts anticipate a 25 basis point interest rate increase. Federal Reserve guidance regarding subsequent rate policy decisions will command significant market attention.
From an on-chain perspective, Ethereum’s Market Value to Realized Value (MVRV) Ratio currently registers at -5%. Historical patterns indicate that when this metric transitions above zero following bear market conditions, it has typically signaled the beginning of bullish cycle phases.
Examining the daily chart, ETH confronts resistance at the $2,544 level. The Relative Strength Index reads 63, while the 50-day and 200-day exponential moving averages converge toward a golden cross pattern. Subsequent resistance targets above current levels include $2,626 and $2,786.
Get 3 Free Stock Ebooks
Discover top-performing stocks in AI, Crypto, and Technology with expert analysis.
- Top 10 AI Stocks - Leading AI companies
- Top 10 Crypto Stocks - Blockchain leaders
- Top 10 Tech Stocks - Tech giants



