



Key Takeaways
- SUI currently hovers near $0.7246, showing a modest 0.33% gain with total market capitalization at $2.97 billion
- The asset faces resistance at a downward-sloping trendline around $0.74, where selling pressure appears to be weakening
- A sustained breakout above $0.7641 could trigger upside movement toward $0.9564, followed by the key $1.00 psychological barrier
- Liquidation metrics reveal $525,940 in long positions closed versus only $75,160 in short liquidations over 24 hours
- Technical analyst Ali Charts identifies a TD Sequential buy indication on the daily timeframe, suggesting a possible 1–4 candle recovery phase
The Sui token (SUI) is currently exchanging hands at roughly $0.7246, registering a modest daily increase of 0.33% based on CoinGlass market data. With 4.09 billion tokens in circulation from a maximum supply of 10 billion, the network maintains a market valuation of $2.97 billion.
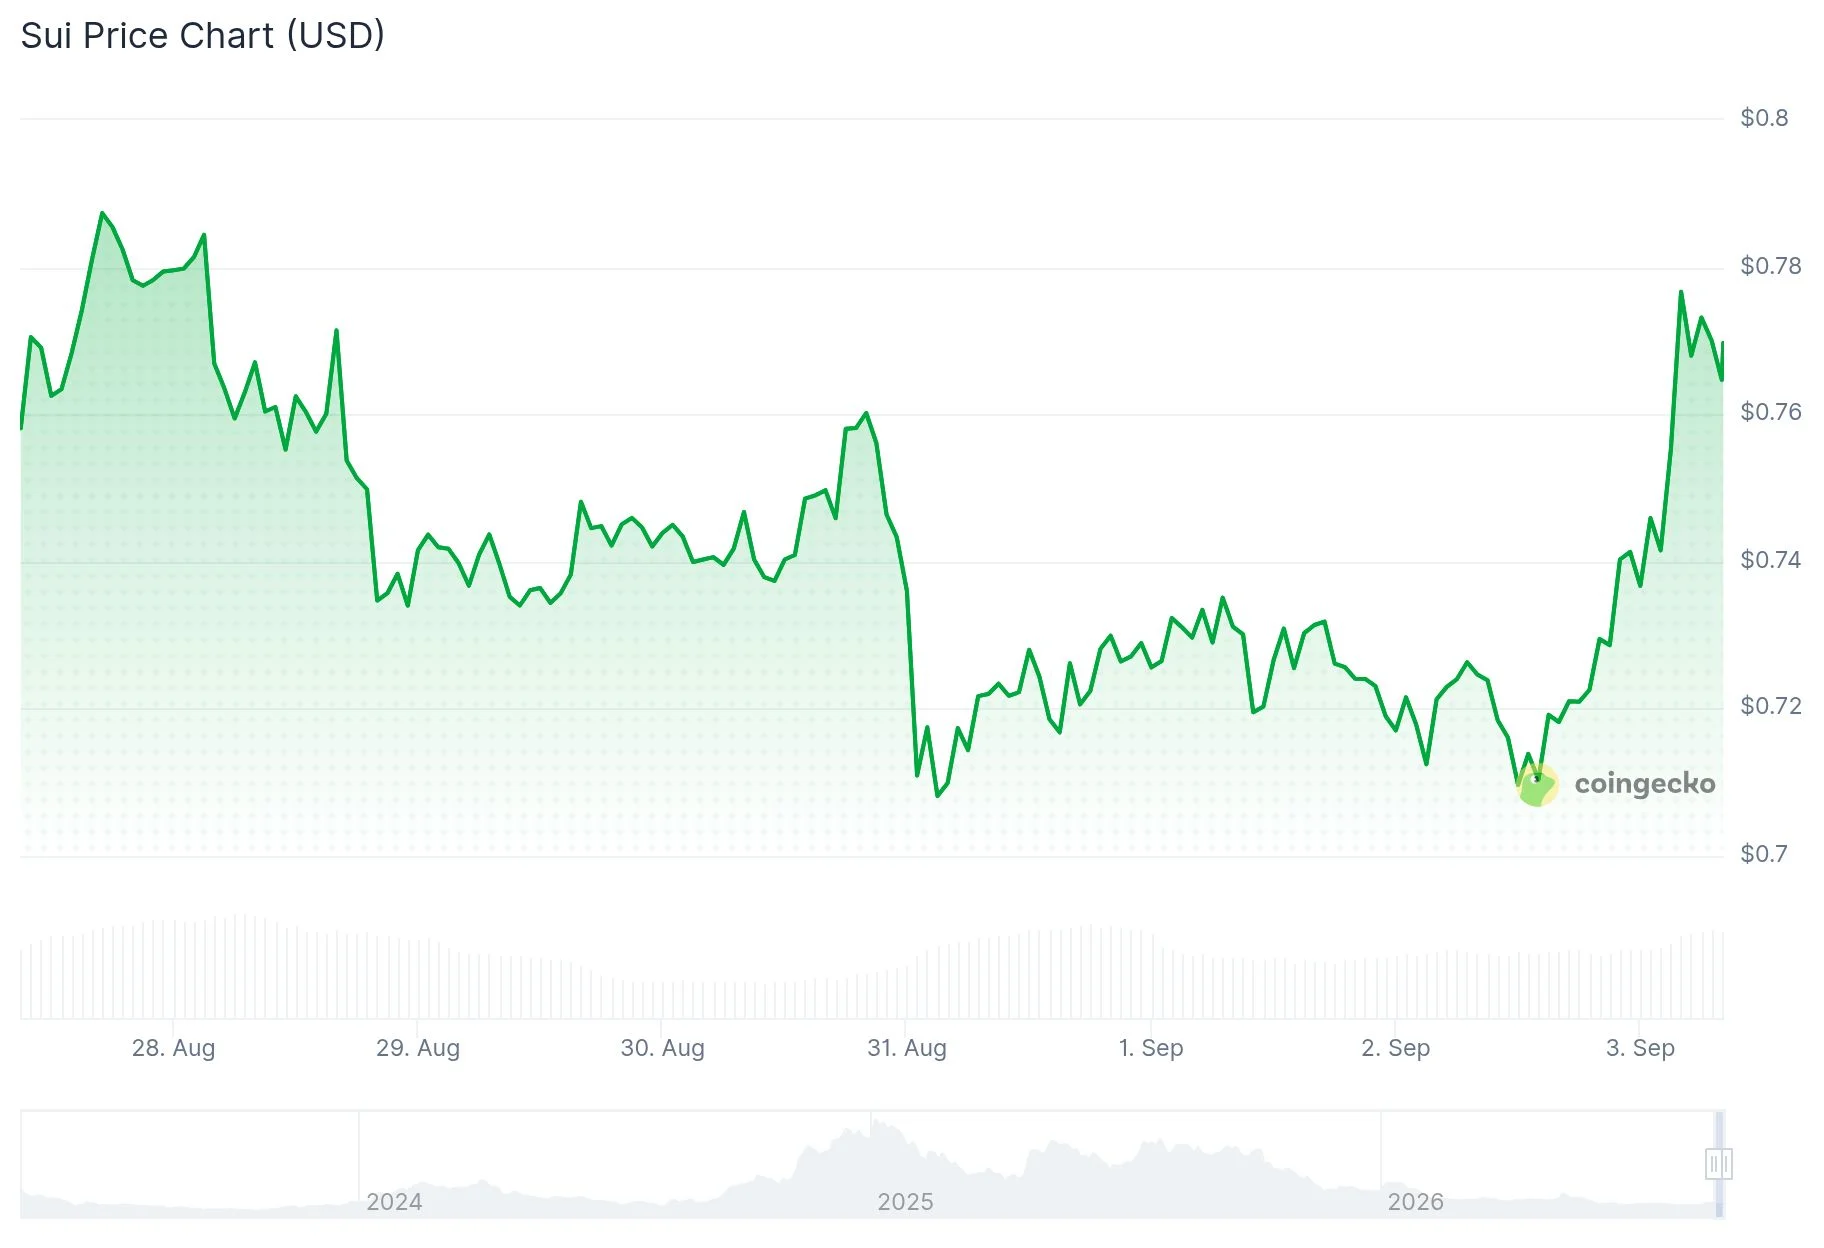
Derivatives trading activity reached $607.97 million in 24-hour volume, while spot markets recorded $104.45 million. Open interest stands at $581.34 million, indicating substantial trader engagement at current price levels despite prolonged consolidation beneath overhead resistance.
The critical threshold traders are monitoring sits at $0.7641. A definitive 4-hour candle closure above this mark on Binance would signal a confirmed breach of the descending resistance line that has constrained upward movement for multiple weeks.
Should this breakout materialize, the subsequent barrier emerges at $0.9564, with the psychologically significant $1.0000 level following as a major target that typically draws heightened market attention.
Conversely, a decisive move below $0.6510 would open the path toward $0.5670 on the downside.

Leverage Unwind Hits Long Positions Hardest
Liquidation metrics from CoinGlass over the trailing 24-hour period reveal an asymmetric pattern favoring short liquidations. Long positions totaling $525,940 were forcibly closed compared to merely $75,160 in short liquidations, demonstrating that leveraged bulls attempting to anticipate a bottom have already absorbed significant losses.
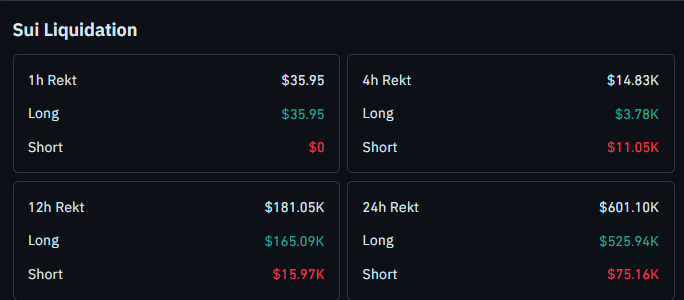
The most recent 4-hour window shows a reversal in this dynamic, with $11,050 in short liquidations versus $3,780 in long closures, indicating that some resistance-level sellers are beginning to face pressure.
Binance’s top trader positioning reflects a 72.5% long bias with a long-to-short ratio of 2.63. Retail participant sentiment mirrors this at 66.9% long exposure. The taker buy-to-sell ratio registers at 1.22, pointing to ongoing buying activity in the market.
Despite this bullish positioning, SUI has failed to establish a convincing close above the $0.74 threshold.
Technical Indicators Show Consolidation Pattern
The daily MACD histogram has compressed to near-zero values, reflecting equilibrium between buying and selling momentum. Market participants are essentially balanced at this price zone.
A Stochastic oscillator reading of 13.59 places SUI in extreme oversold conditions, historically a precursor to potential relief rallies before further declines materialize. Bollinger Band analysis shows price action gravitating toward the lower boundary rather than the upper range.
Technical analyst Ali Charts highlighted via social media that the TD Sequential system is generating a buy indication on the SUI daily timeframe. According to his assessment, this signal implies the current correction phase may be approaching completion, potentially triggering a 1–4 candle bounce or initiating a fresh bullish sequence.
Spot trading volume on Binance reached $41.3 million in recent trading sessions, which market observers characterize as insufficient momentum for a sustained breakout without additional fundamental catalysts.
The 200-day exponential moving average currently resides at $0.85, representing a crucial level that would need to be recaptured before any meaningful trend reversal could be validated.
Get 3 Free Stock Ebooks
Discover top-performing stocks in AI, Crypto, and Technology with expert analysis.
- Top 10 AI Stocks - Leading AI companies
- Top 10 Crypto Stocks - Blockchain leaders
- Top 10 Tech Stocks - Tech giants



