


Key Takeaways
- SOL has declined 10% over the last month following a breakdown from crucial trend line support
- ETF products tracking Solana recorded just $14.6 million in net inflows during July, with June posting net outflows
- Daily active user metric moving average crossover historically precedes significant price volatility
- Current trading below the 100-day SMA ($78.06) and 200-day SMA ($84.71) indicates sustained downward pressure
- Critical support zones include $72, $70, and the broader $66–$67 range
Solana (SOL) continues to struggle near the $73 mark following a 10% retreat across the previous 30-day period. After breaking beneath critical trend line support, the asset has established a bearish descending channel pattern visible on daily timeframes.
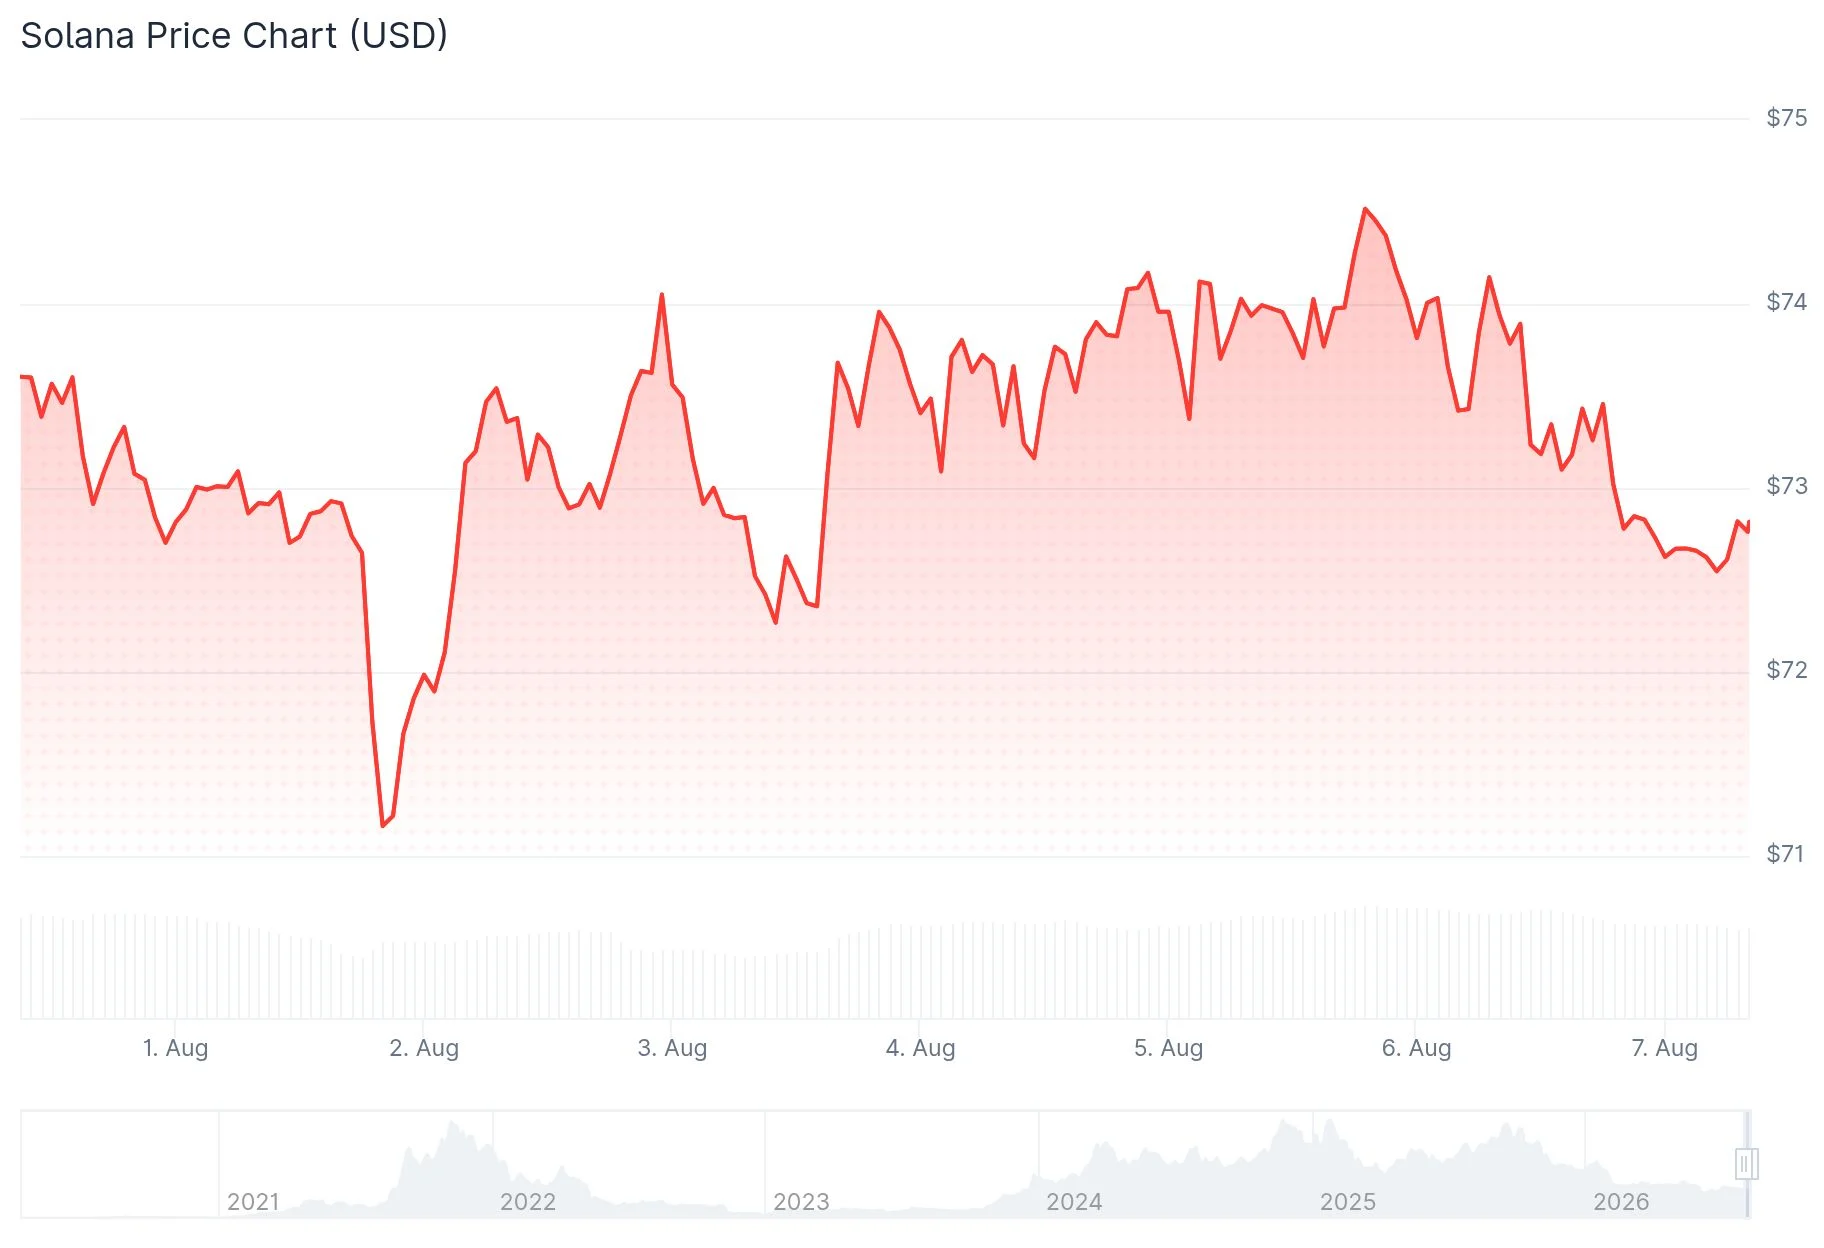
Trading beneath both the 100-day simple moving average at $78.06 and the 200-day SMA positioned at $84.71, the token faces continued technical headwinds that complicate any near-term recovery prospects.
Bears have maintained dominance throughout recent weeks. SOL has established a pattern of consecutive lower highs after unsuccessfully attempting to breach the late July resistance zone around $82. Technical oscillators paint a concerning picture: the stochastic indicator has plummeted to 3.06, signaling extreme oversold conditions, while the Ultimate Oscillator registers at 38.8.
Exchange-traded fund appetite for SOL exposure remains notably subdued. July recorded a meager $14.6 million in net inflows, while June actually witnessed $800,000 in net outflows. These figures underscore the absence of meaningful institutional capital flowing into the cryptocurrency.
From an on-chain perspective, a notable crossover between the 30-day and 50-day moving averages for daily active users has emerged. Historical precedent suggests this indicator often foreshadows substantial price movements for SOL.

Network Metrics Present Conflicting Signals
Various blockchain activity indicators reveal mounting pressure as August unfolds. Decentralized exchange volumes contracted 9% throughout July, totaling $51 billion. Current August trends suggest a monthly projection near $44 billion.
Application fees demonstrated modest growth, climbing from $186 million to $200 million in July. August projections indicate fees could reach approximately $220 million, representing incremental improvement.
Notwithstanding subdued price performance, crypto analyst Nebraskangooner highlighted on X that Solana’s underlying fundamentals demonstrate resilience. His analysis emphasized July’s exceptional performance, with Solana applications generating $82.9 million in revenue — the strongest showing since February — capturing 16.5% of total blockchain revenue and surpassing Ethereum during that window. Stablecoin circulation achieved an all-time high of $15.7 billion, while the network executed more than one billion non-vote transactions within a single week.
Market Valuation Metrics Show Significant Contraction
During 2024, SOL commanded valuations between $130 and $180 despite comparable DEX volumes and application fees to present levels. Market participants have subsequently reduced their willingness to assign premium valuations to Solana’s current activity metrics.
Throughout 2024, Solana concluded the year with $662 billion in DEX volumes and $2.55 billion in app fees, ultimately reaching $190. Current year projections suggest DEX volumes approaching $1 trillion alongside app fees potentially hitting $2.8 billion — yet SOL struggles below $80.
The Relative Strength Index presently reads 44. Declining below 40 would activate a technical sell signal. The established descending channel formation suggests a potential retest of $68 support, with the $60 threshold becoming relevant should lower support levels fail to hold.
Initial support materializes at $72. Penetration of this level establishes a pathway toward $70, followed by the $66–$67 support zone.
Get 3 Free Stock Ebooks
Discover top-performing stocks in AI, Crypto, and Technology with expert analysis.
- Top 10 AI Stocks - Leading AI companies
- Top 10 Crypto Stocks - Blockchain leaders
- Top 10 Tech Stocks - Tech giants



