



Key Takeaways
- HYPE currently hovers at $60.40, attempting to breach the critical $64 resistance within a falling wedge formation
- Derivatives market activity surges with Open Interest reaching an unprecedented $5.7 billion
- Platform engagement has declined with weekly active users falling from 190,000 in June to approximately 149,600
- Breaking above $64 resistance could trigger a rally toward the $72 target zone
- Bulls are defending the 100-day EMA positioned near $57.5 as a crucial support floor
The Hyperliquid native token HYPE is currently positioned around $60.40 following an extended period of downward price consolidation. Technical analysis reveals the formation of a falling wedge pattern on the charts, a configuration frequently interpreted as a precursor to bullish reversals once buying pressure intensifies.
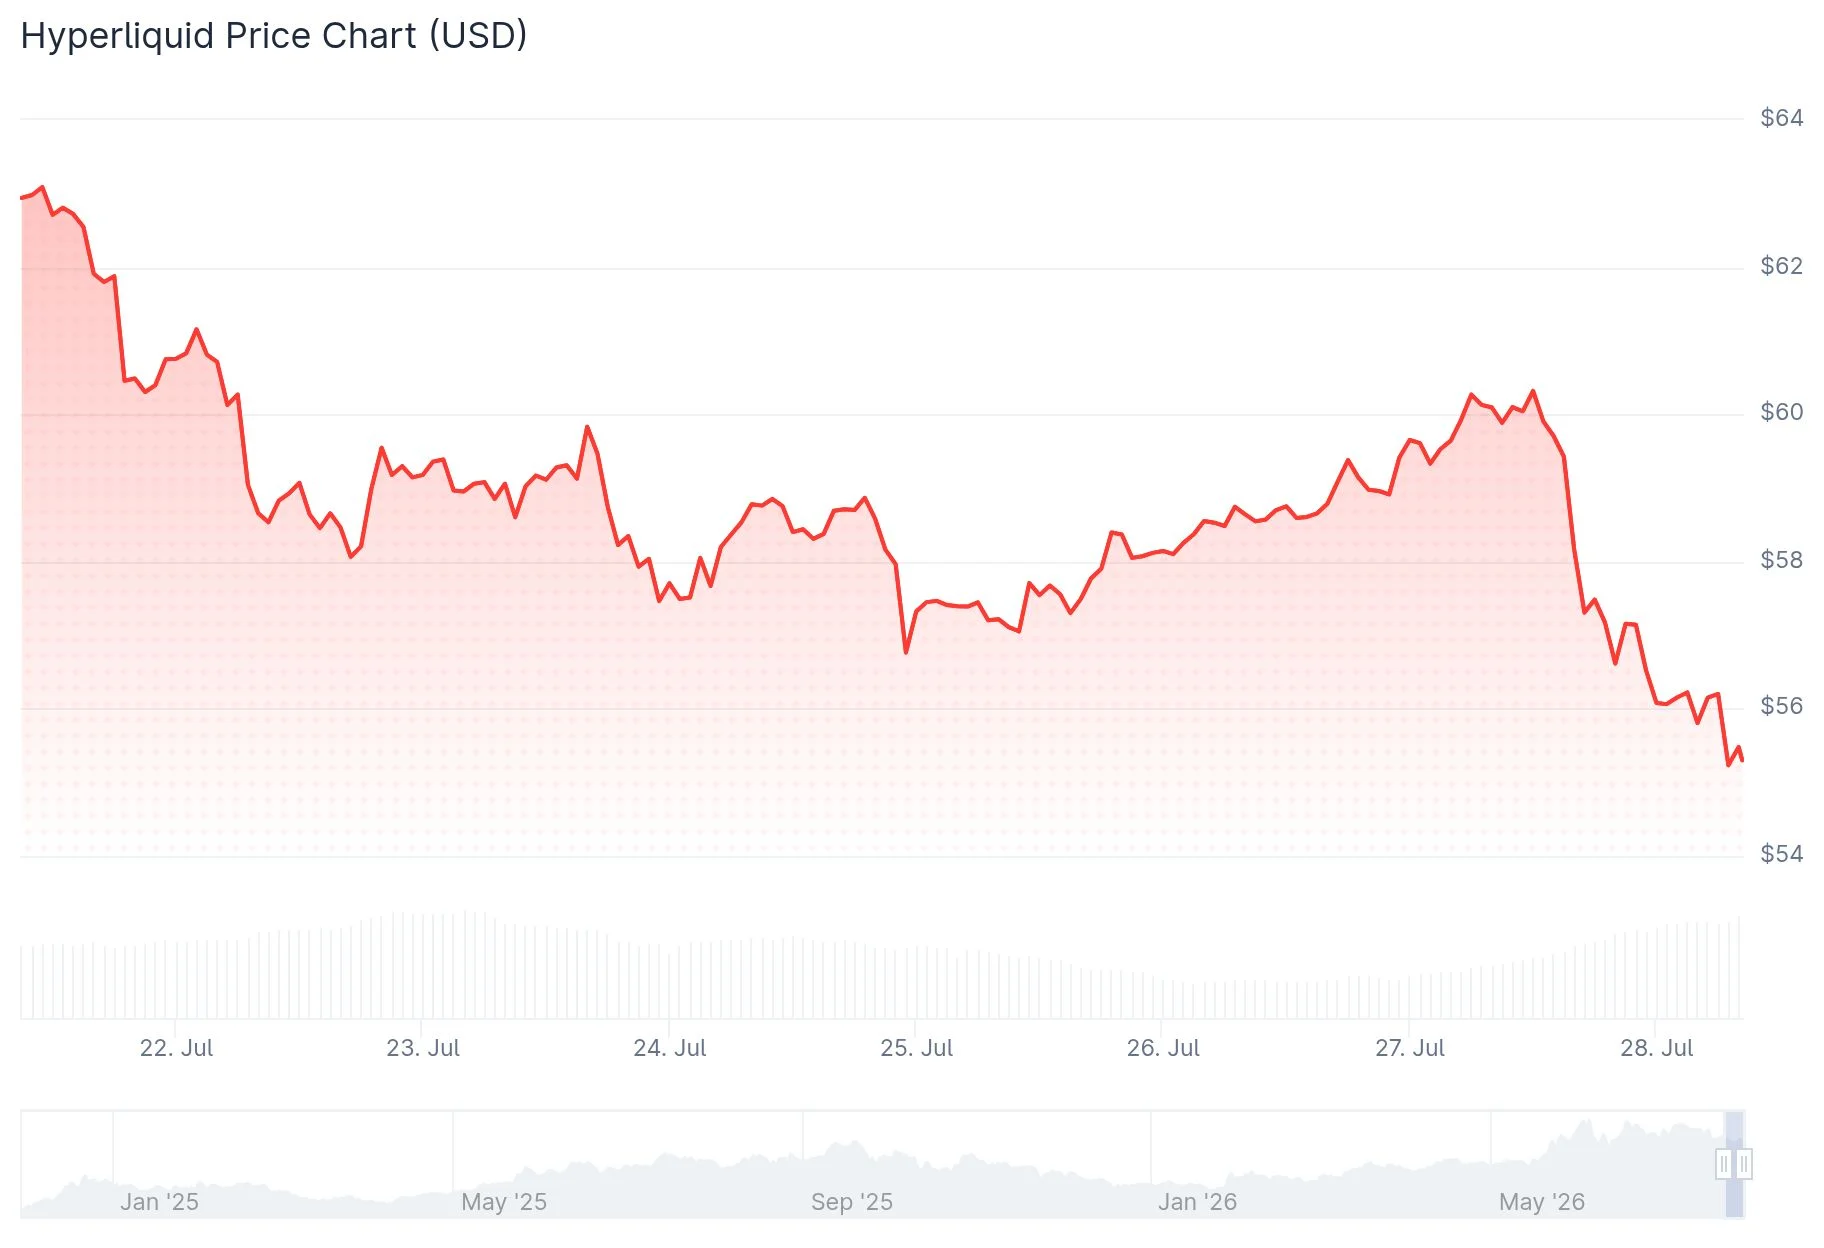
Following a peak near the $72 mark, HYPE entered a corrective phase characterized by descending highs while maintaining a support foundation between $56 and $57. The immediate challenge lies at $64, a resistance zone that has repeatedly turned back bullish attempts throughout recent weeks.
The Relative Strength Index has bounced back to approximately 45 after approaching oversold conditions. Meanwhile, the MACD histogram continues to contract, indicating diminishing bearish pressure. However, a definitive bullish crossover remains absent, meaning technical confirmation is still pending.
Should buyers successfully propel HYPE beyond the $64 threshold with substantial volume support, the subsequent upside objective would be the $72 zone where previous distribution occurred. Conversely, failing to clear $64 resistance may extend the current consolidation phase.
Derivatives Market Expansion Contrasts With User Decline
The Open Interest metric on Hyperliquid has surged to an all-time high of $5.7 billion, signaling increased capital deployment into perpetual futures contracts on the decentralized exchange.

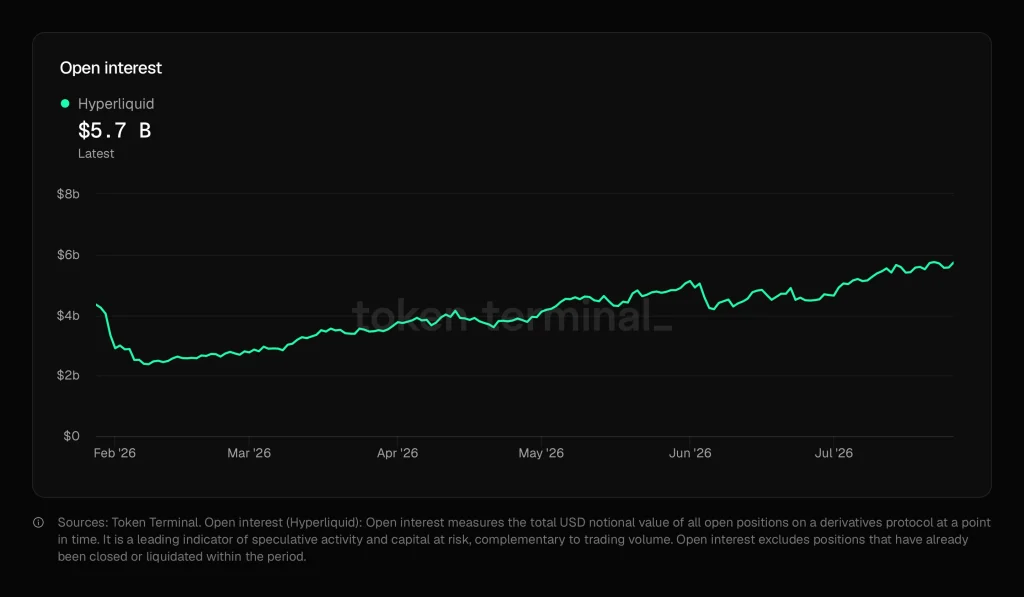
Despite this derivatives growth, weekly active user counts have contracted from nearly 190,000 in early June to roughly 149,600 currently. This downtrend indicates reduced retail participation compared to the platform’s initial adoption surge.
The divergence between expanding derivatives exposure and contracting user engagement warrants careful monitoring. Escalating leverage combined with weakening on-chain participation could amplify volatility around critical technical thresholds.
Critical Support Zones Under Observation
HYPE is presently testing the 100-day exponential moving average positioned around $57.5, a level that has provided reliable support during the broader upward trajectory.
Should this support fail, attention would shift to the 200-day EMA located near $50. A breakdown below the 100-day EMA would also compromise the intermediate bullish framework established since March.
Trading volume has gradually diminished throughout the correction, which market observers interpret as profit realization rather than panic liquidation. The RSI reading of 43 provides additional upside headroom before entering overbought conditions.
Market analyst Altcoin Sherpa commented on X that despite near-term weakness, a pullback into the mid-$50s or even mid-$40s would present an attractive accumulation zone. He maintains his longer-term projection of HYPE reaching $100.
HYPE is currently trading at $60.40, positioned beneath the 26-day EMA at $62 and the 50-day EMA at $64.3.
Get 3 Free Stock Ebooks
Discover top-performing stocks in AI, Crypto, and Technology with expert analysis.
- Top 10 AI Stocks - Leading AI companies
- Top 10 Crypto Stocks - Blockchain leaders
- Top 10 Tech Stocks - Tech giants



