



Key Takeaways
- SOL currently hovers near $76, with a critical support zone determining its next trajectory
- Cross-chain capital influx exceeds $26 million over the past week into Solana’s ecosystem
- Maintaining the $74–$75 range is essential for bulls to sustain upward momentum
- Clearing resistance at $82–$85 would establish a path toward $94, with $125 as an extended target
- Failure to defend support could trigger a decline into the $64–$70 territory
At press time, Solana (SOL) trades at $76.17, commanding a market capitalization of $44.4 billion alongside 24-hour trading activity totaling $1.8 million.
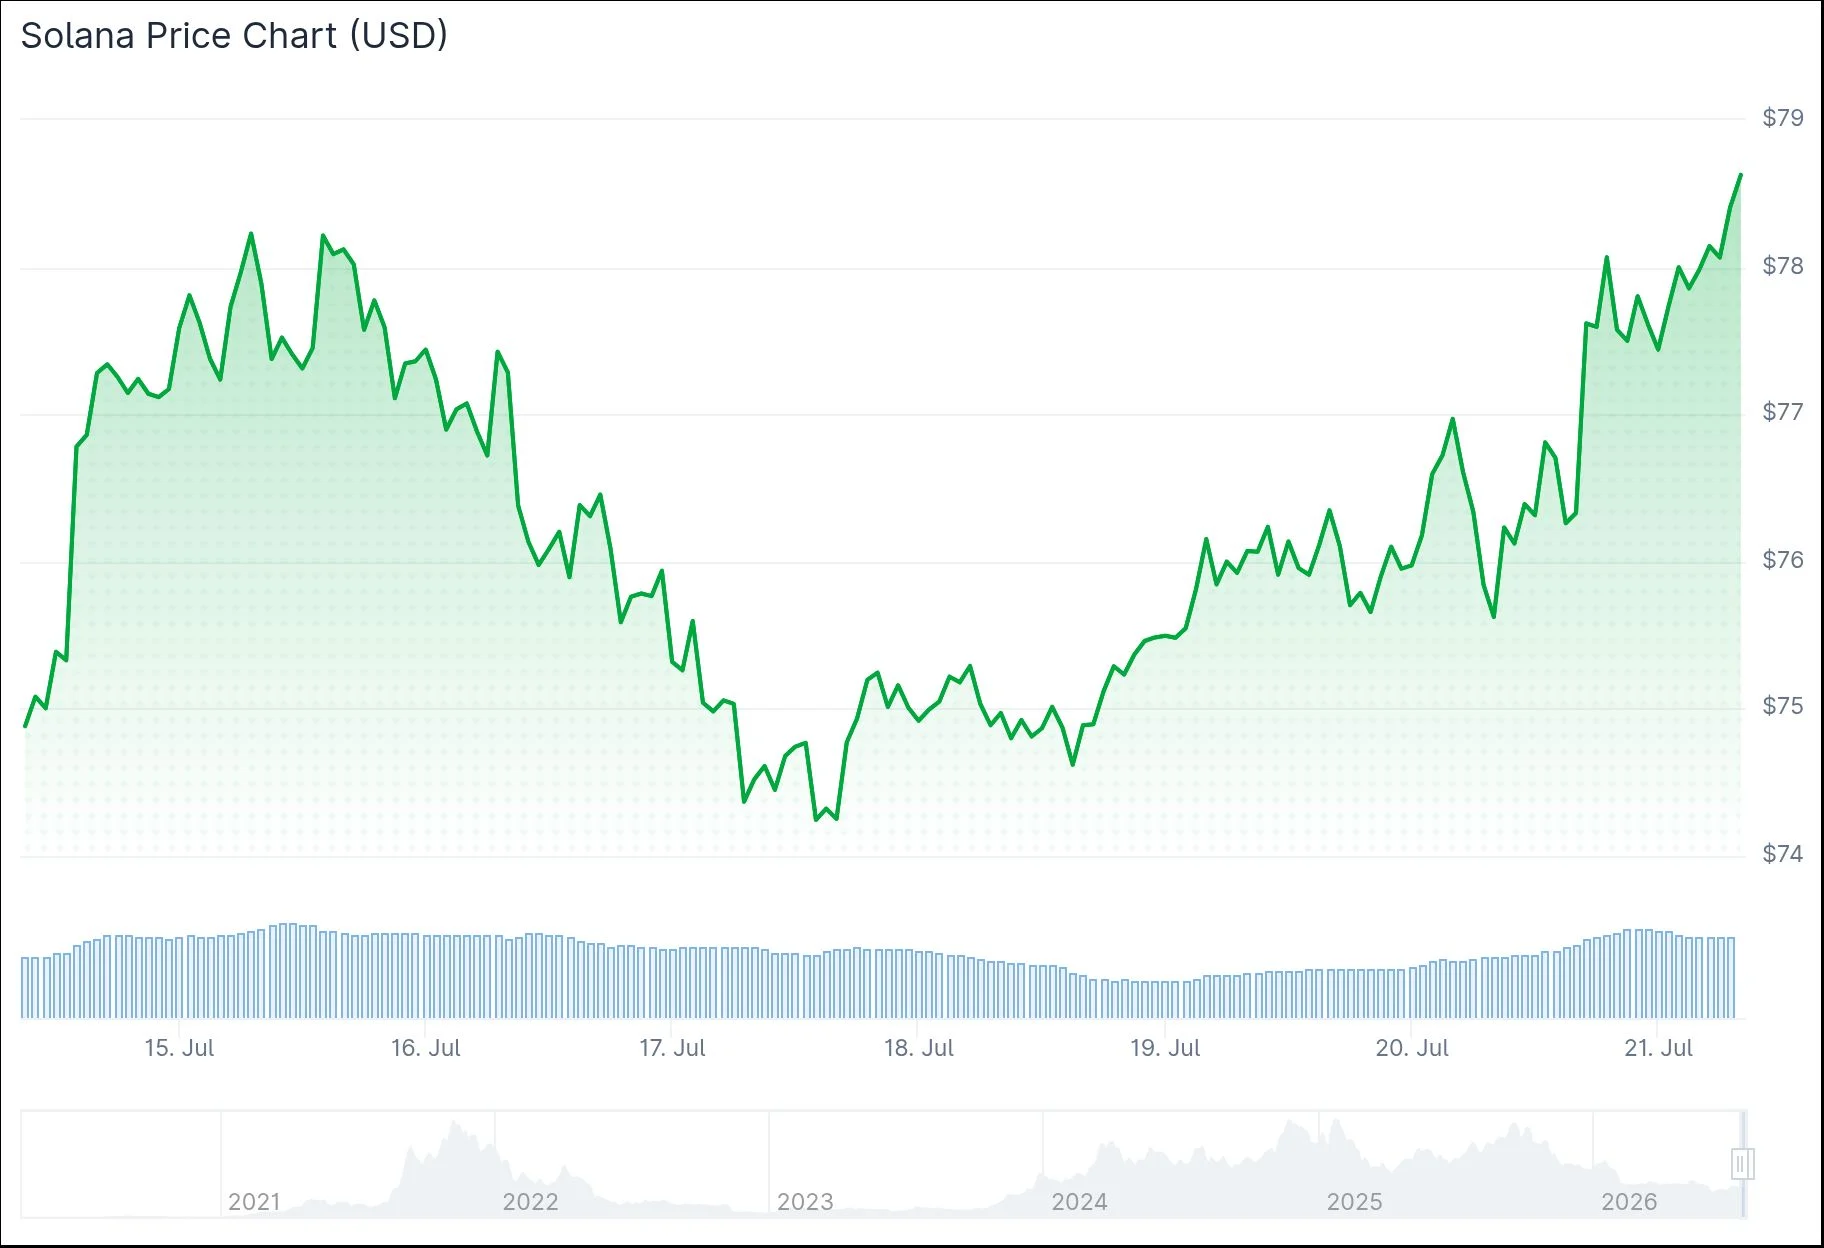
The digital asset remains anchored near a pivotal support threshold, with its subsequent direction largely contingent on whether demand can sustain these levels.
Market analyst Daan Crypto Trades highlighted that SOL is nearing a critical technical juncture on higher timeframes. According to his assessment, buyers must successfully defend present levels and establish a higher low to preserve the bullish structural integrity.
Should this defense prove successful, the subsequent obstacle emerges around $97, representing the upper limit of the existing range.
Conversely, if support collapses, market observers anticipate SOL could retreat toward the mid-60s, an area that previously demonstrated substantial buying interest. The $64.69 level specifically represents a significant support foundation beneath current valuations.

Wave Analysis Indicates $82–$94 Potential
Examining the hourly timeframe reveals SOL testing the 38.2% Fibonacci retracement level around $74. Under an optimistic interpretation, this represents a corrective wave completion before resuming upward movement.
Initial resistance materializes between $78.40 and $82.30. Successfully breaching this zone would establish targets in the $89–$94 range.
Should price action slip below $74, the correction may extend toward $71.17, with $68.42 as a secondary downside target.
$26M Capital Migration Strengthens Network
According to Solana Floor analytics, over $26 million in bridged assets entered the Solana blockchain throughout the previous seven-day period.
Such capital movement signals revitalized confidence in the platform. Solana’s efficient transaction processing, minimal fee structure, and vibrant decentralized finance landscape continue drawing resources from competing networks.
Market commentator Crypto Patel offered his perspective via X, cautioning that breaking below the present ascending channel structure might trigger movement toward the $70–$50 accumulation territory. His long-term outlook remains exceptionally bullish, projecting eventual targets of $500 followed by $1,000, while characterizing the $70–$50 zone as an optimal entry point for strategic accumulation.
Weekly chart analysis shows Solana protecting a support region around $75 that previously catalyzed a swift ascent toward $140. The weekly Relative Strength Index exhibits ascending lows near support, a configuration suggesting waning bearish momentum.
The 20-week exponential moving average positioned near $85 constitutes the initial overhead barrier, followed by a resistance concentration spanning $110–$125. Penetrating above $125 would activate the yearly opening price near $143 as the next objective.
The documented $26 million in weekly cross-chain capital influx represents the most current evidence supporting sustained engagement within Solana’s ecosystem.
Get 3 Free Stock Ebooks
Discover top-performing stocks in AI, Crypto, and Technology with expert analysis.
- Top 10 AI Stocks - Leading AI companies
- Top 10 Crypto Stocks - Blockchain leaders
- Top 10 Tech Stocks - Tech giants



