


Key Points
- Intel (INTC) shares descended to $103.12 during widespread semiconductor sector pressure and mounting AI expenditure worries.
- The chipmaker unveiled a $5.7 billion AI development budget, sparking debates about profitability in upcoming quarters.
- Price action stayed beneath both the EMA20 and EMA50 levels, validating persistent bearish technical conditions.
- The daily RSI moved toward oversold levels, accompanied by MACD signals indicating intensifying downside momentum.
- Critical support emerges around $101.22, with overhead resistance positioned at $103.69 and $105.60.
Intel (INTC) shares retreated to $103.12 on July 13 during a semiconductor sector downturn accompanied by fresh capital expenditure announcements that rattled investor confidence. The movement occurred alongside a broader technology hardware selloff and heightened scrutiny over Intel’s profitability outlook. The chipmaker now confronts a critical juncture where deteriorating technicals intersect with a substantial $5.7 billion artificial intelligence commitment.
Moving Averages and Indicators Reflect Ongoing Bearish Momentum
Intel (INTC) shares remained positioned beneath the 20-day exponential moving average of $118.36 alongside the 50-day measure at $110.61. The stock finished the session touching the lower daily Bollinger Band at $103.12. This placement demonstrated intense distribution activity, contrasting sharply with the Bollinger midline stationed considerably higher at $123.88.
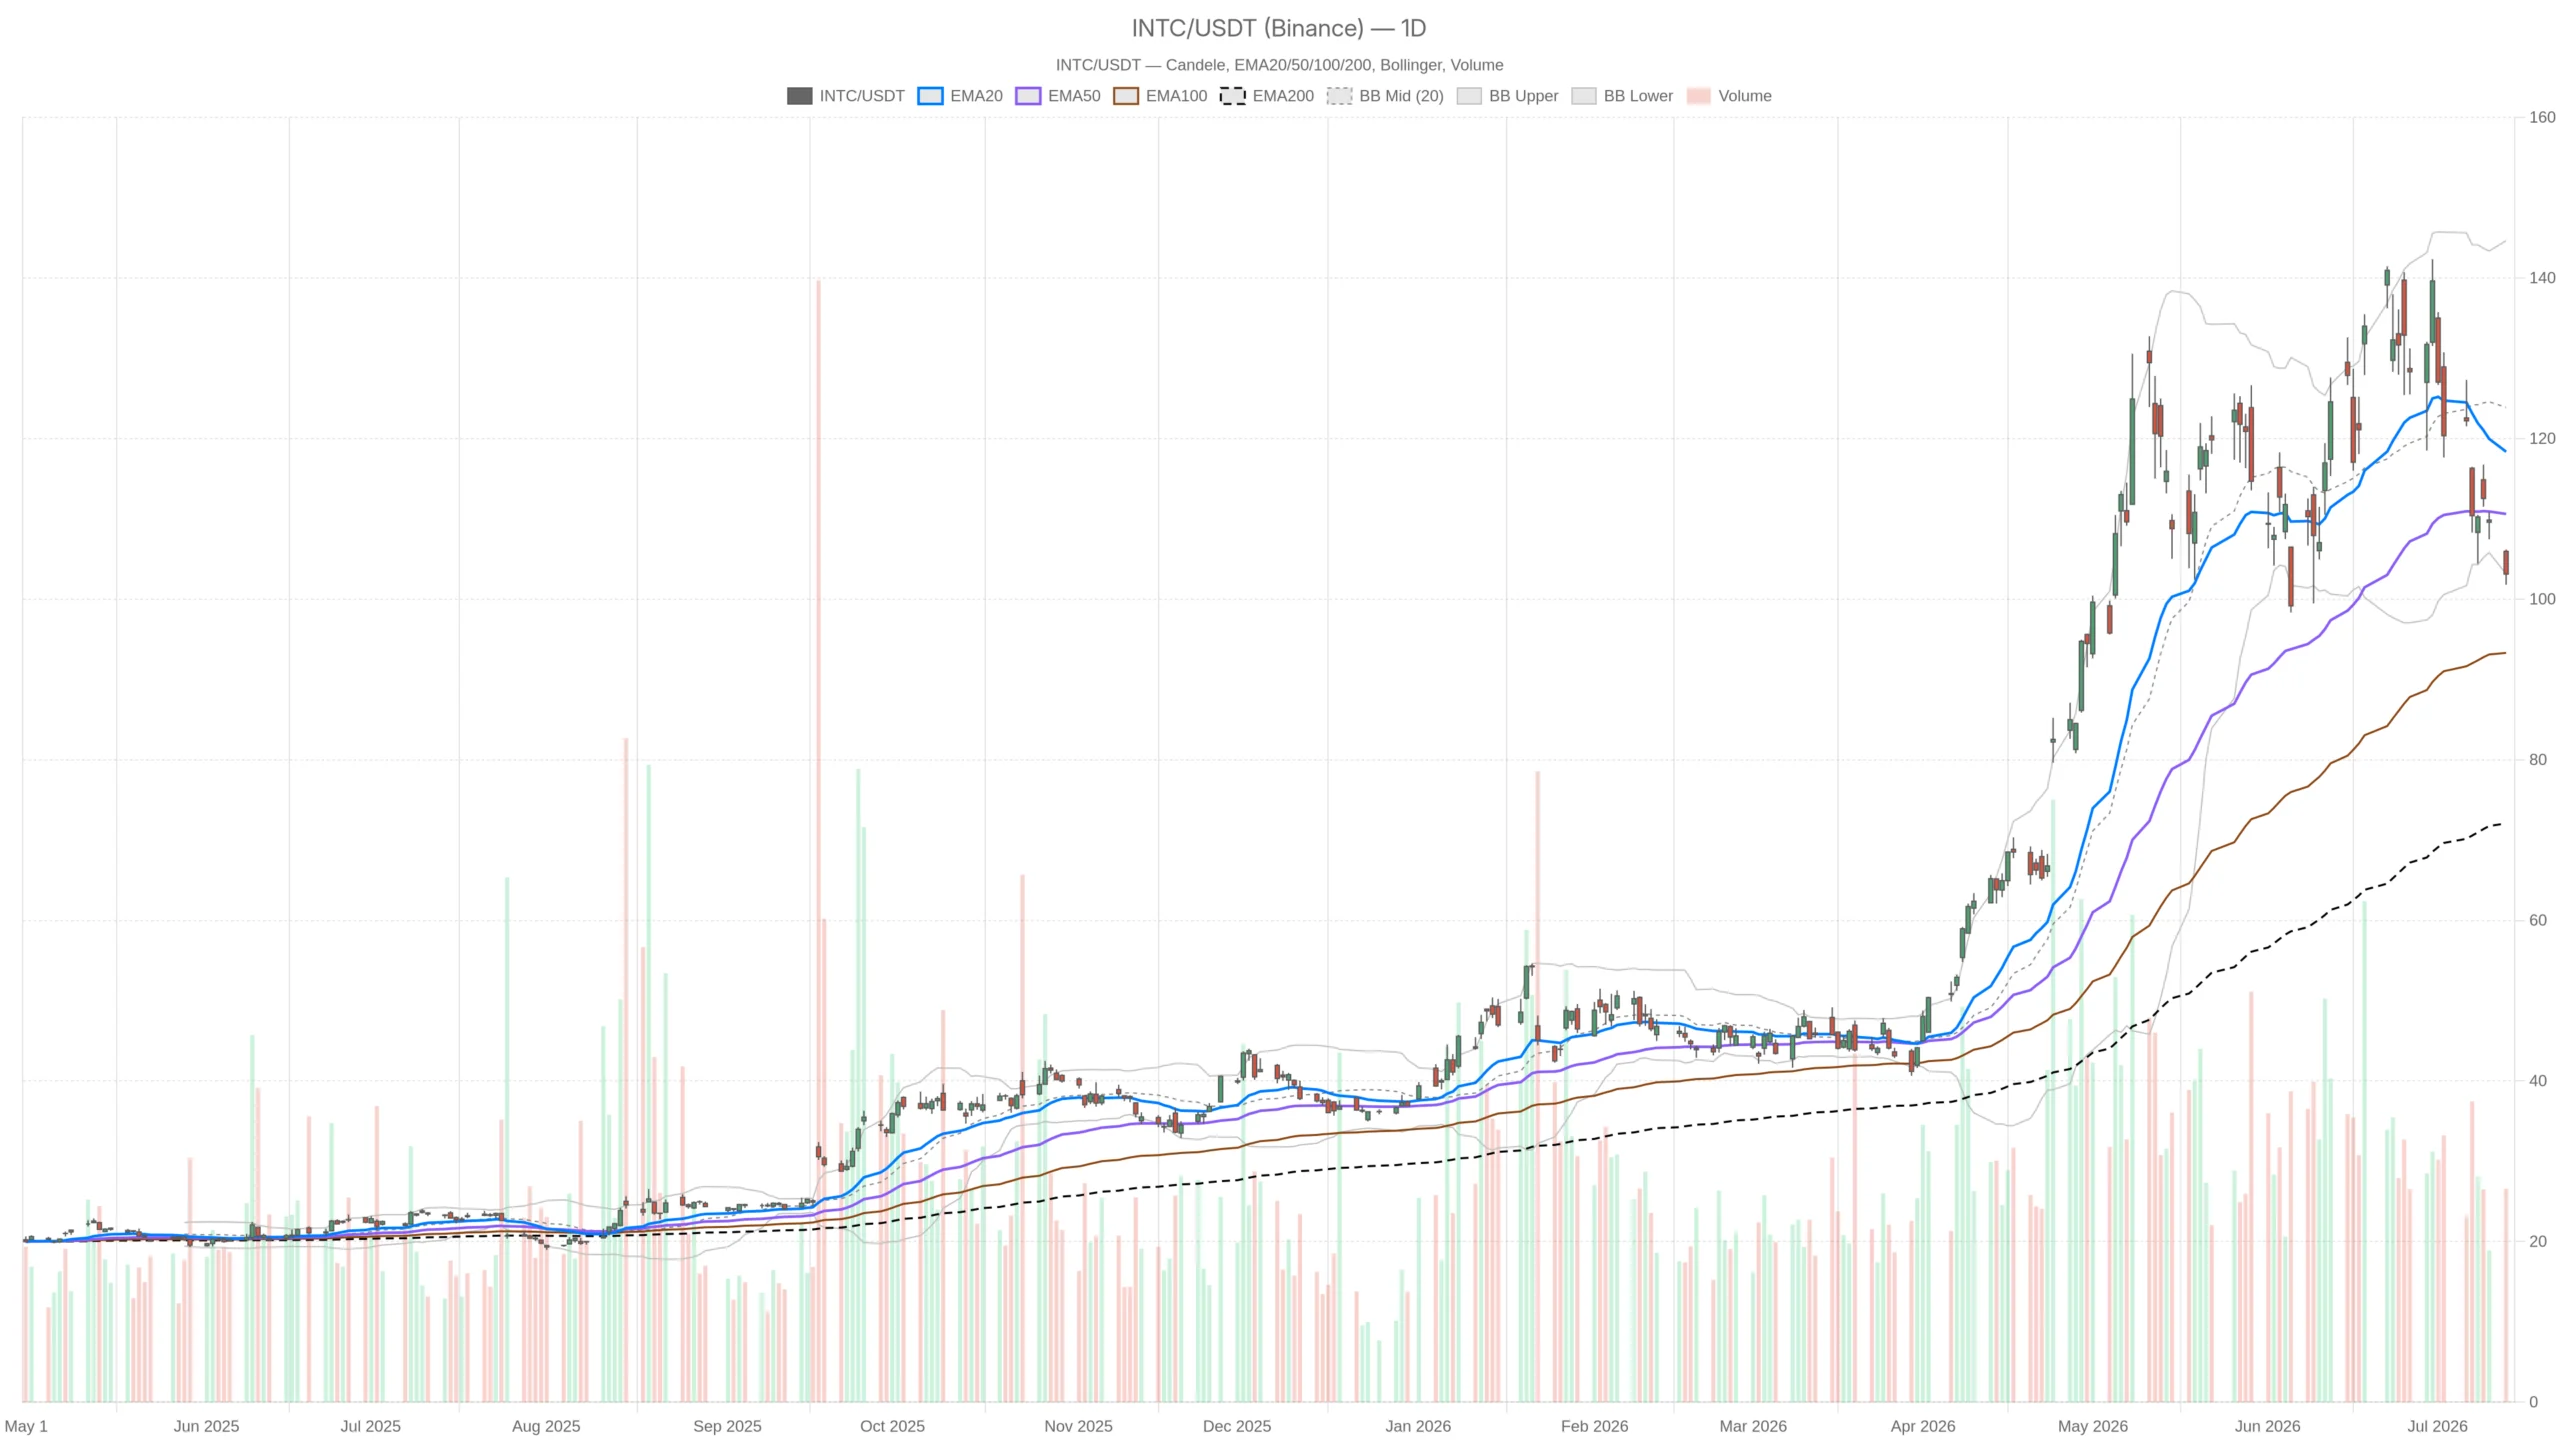
The daily relative strength index registered 39.4, nearing oversold conditions yet failing to signal an imminent reversal. Concurrently, the moving average convergence divergence line measured negative 1.38, positioned below its signal at 2.26. The histogram reading of negative 3.64 indicated that downside momentum gained speed throughout the most recent trading period.

Intel (INTC) also settled beneath the daily pivot level of $103.69, further undermining its near-term technical framework. The first resistance barrier appeared at $105.60, while support materialized around $101.22. A breach below this support zone could potentially expose the round-number $100 threshold during subsequent market turbulence.
Intraday Timeframes Display Minimal Recovery Signs
The hourly chart maintained Intel (INTC) beneath all three primary exponential moving averages. The 20-hour measure stood at $107.25, while both the 50-hour and 200-hour averages remained substantially elevated. This bearish configuration illustrated persistent selling across multiple timeframes.
The hourly relative strength index dropped to 30.26, suggesting that liquidation had reached extended levels. The hourly MACD histogram contracted to negative 0.42, demonstrating that downside pressure had begun moderating. Price hovered near $103.08, with nearby hourly support identified at $102.18 and resistance at $103.79.
The 15-minute timeframe revealed only marginal improvement in buying interest during closing hours. Intel Stock persisted below its 15-minute EMA20 at $103.57 and EMA50 at $105.90. Despite the MACD histogram turning marginally positive, the overall technical framework remained decidedly bearish.
Massive AI Budget and Industry Headwinds Drive Declines
Intel announced intentions to allocate $5.7 billion toward advancing its artificial intelligence initiatives and corresponding infrastructure. This commitment underscored Intel’s strategic positioning for future technology leadership, yet simultaneously elevated questions about immediate profitability. Intel (INTC) shares weakened as investors weighed whether anticipated expansion could justify elevated operational and capital expenses.
The downturn also followed weakness across chip manufacturers after concerning developments involving South Korean semiconductor companies. Intel, AMD, and Applied Materials each shed approximately 4% as selling momentum rippled through global technology equities. Rising crude oil prices contributed additional market uncertainty and amplified pressure on growth-oriented stocks.
Intel (INTC) shares could experience continued fluctuation ahead of the company’s upcoming earnings disclosure. A meaningful recovery would necessitate reclaiming the $103.69 level, followed by clearing resistance zones near $105.60 and $110.61. Intel (INTC) closed at $103.12, with bearish technical momentum and profitability concerns continuing to influence the current market perspective.
Get 3 Free Stock Ebooks
Discover top-performing stocks in AI, Crypto, and Technology with expert analysis.
- Top 10 AI Stocks - Leading AI companies
- Top 10 Crypto Stocks - Blockchain leaders
- Top 10 Tech Stocks - Tech giants



