



Key Takeaways
- SOL maintains position around $76, defending critical support between $73–$77
- Next significant resistance sits at $87; successful breach may pave way to $100
- Trader Michaël van de Poppe warns that falling below $73 could lead to retesting recent lows
- Extended timeframe analysis reveals potential accumulation range from $30–$52 during deeper pullbacks
- Circle’s 250M USDC minting on Solana indicates sustained blockchain engagement
Solana currently hovers around $76.33, maintaining its position above a crucial short-term support boundary spanning $73 to $76. The token registered a modest 24-hour increase of 0.41%, though the overall market direction remains ambiguous.
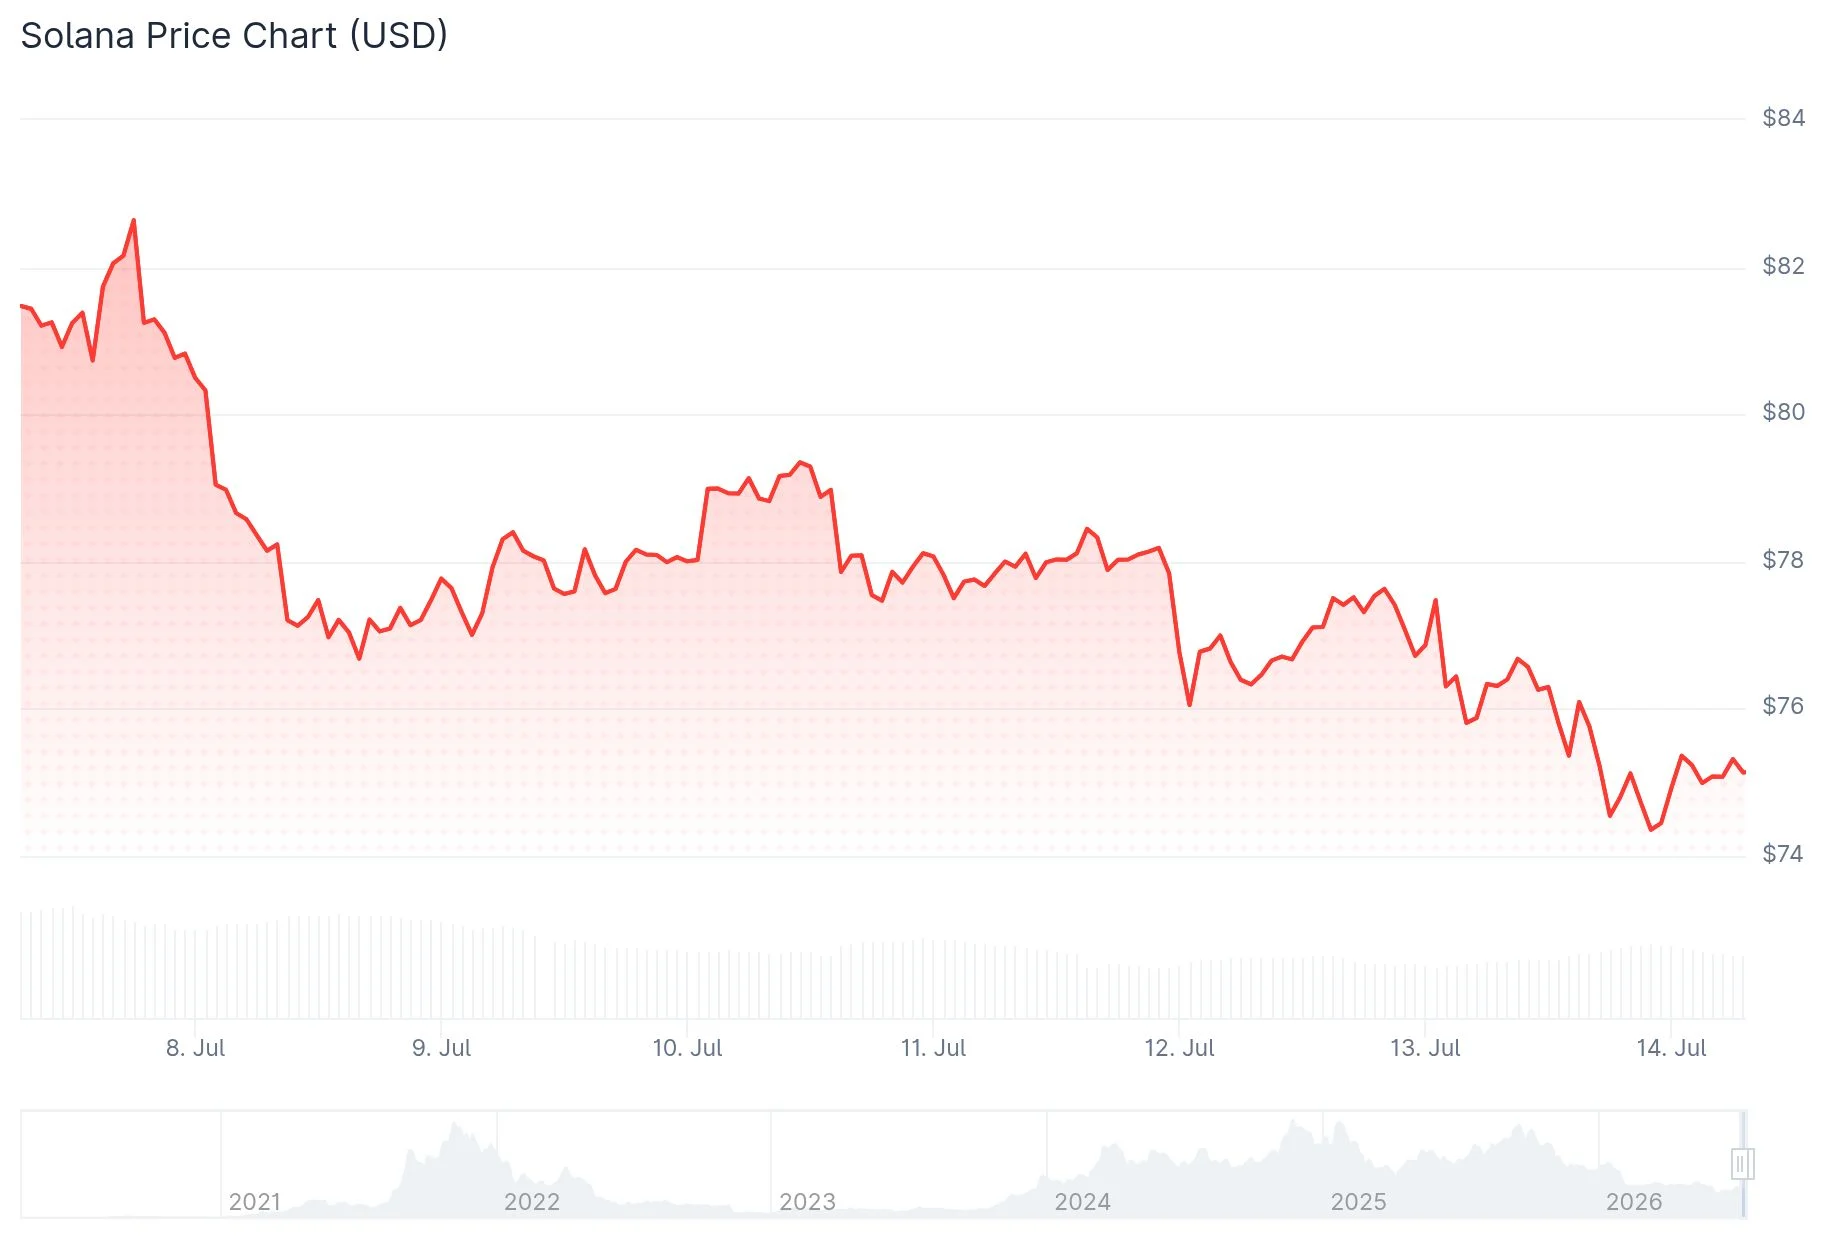
The $73–$76 corridor has emerged as the most critical zone for SOL watchers. Bulls must defend this territory to preserve any hopes of a recovery trajectory. Slipping beneath $73 could unleash additional downward momentum.
Looking upward, the initial objective for optimistic traders stands at $80. Successfully navigating past that threshold would bring $87.20 into view, representing a significant resistance barrier on the daily timeframe.
Potential Breakout Configuration for SOL
Market participants are closely monitoring a long-standing downtrend boundary that SOL is currently challenging. Technical analyst Jesse Peralta’s charting reveals price action testing this resistance level, which has proven resilient for several months.
A validated move above this trendline could pivot sentiment toward the buy side. Should this scenario materialize, $90 followed by $100 emerge as subsequent major milestones.

Nevertheless, the breakout requires validation. A rejection at this juncture combined with a retreat below $73 would likely reinitiate bearish price action.
Trader Michaël van de Poppe shared his perspective on X, describing the current position as “make or break” for SOL. He indicated that maintaining this level could trigger a swift upward movement, potentially leading to further expansion. Conversely, if SOL breaches $73, he anticipates a retest of recent bottom levels within the upcoming weeks.
Certain technical analyses suggest a Wyckoff accumulation pattern developing in SOL. Analyst Seth’s charting indicates SOL may have completed an extended distribution phase and is currently establishing a foundation.
Extended Decline Remains on the Table
Analyst Crypto Patel distributed a three-week timeframe chart illustrating SOL’s descent from the $240 resistance zone, with price remaining beneath crucial obstacles at $95–$100 and $140.
Patel highlights an extended accumulation territory spanning $30 to $52. Should Solana experience further retracement, this zone could present a favorable entry point for position builders.
For any substantial recovery effort, SOL must first recapture the $95–$100 territory. Sustained trading above that range could generate upward momentum targeting $140.
Regarding on-chain developments, Circle executed a 250 million USDC minting operation on Solana, which Cointelegraph characterized as evidence of ongoing liquidity and network utilization.
Several traders are considering $150 as an extended timeframe objective, though reaching that level requires SOL to sequentially overcome $80, $90, and $100 resistance zones.
SOL presently maintains its position above an ascending trendline on the daily chart, with Ichimoku cloud support positioned between $74 and $77.
Get 3 Free Stock Ebooks
Discover top-performing stocks in AI, Crypto, and Technology with expert analysis.
- Top 10 AI Stocks - Leading AI companies
- Top 10 Crypto Stocks - Blockchain leaders
- Top 10 Tech Stocks - Tech giants



