


Key Takeaways
- Solana experienced a minor 1.7% decline but maintained critical support zones while Bitcoin and Ethereum ETFs witnessed capital outflows
- Spot Solana ETFs listed in the U.S. attracted $5.75 million in net capital during the reporting period
- Non-vote transactions on the network surpassed 1 billion weekly for the first time ever
- Active wallet addresses jumped from 16.8 million to 29.7 million within a 14-day span
- The network dominated all Layer 1 and Layer 2 platforms in decentralized application revenue and DEX trading volume
Solana (SOL) registered a 1.7% pullback, trading in the $79–$80 range throughout the latest measurement window, mirroring Bitcoin’s 1.65% decline. The overall cryptocurrency market capitalization contracted by 1.47%, settling at $2.14 trillion. Nonetheless, SOL successfully defended crucial support thresholds.
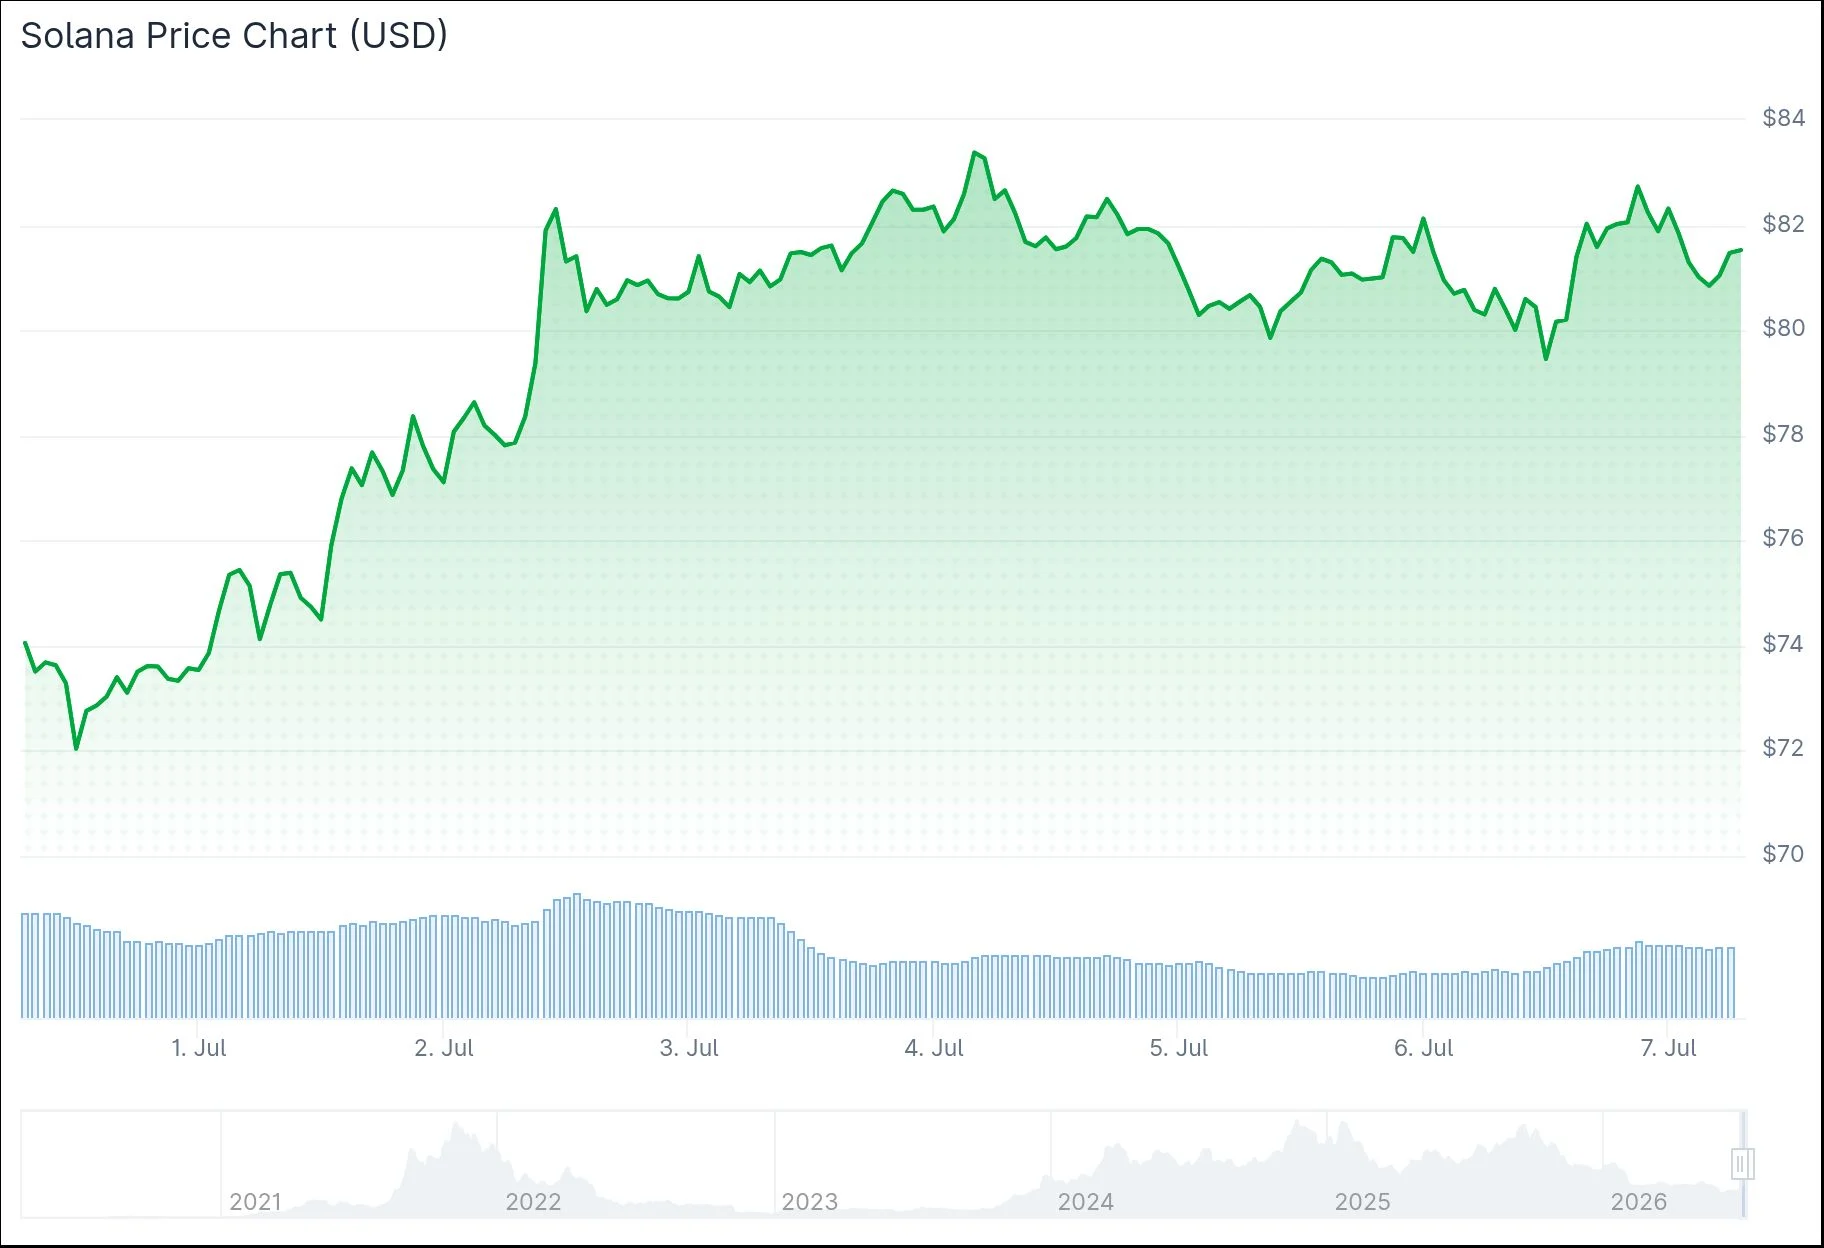
The digital asset remains approximately 73% beneath its peak of $294.33, achieved on January 19, 2025.
The notable development this period was Solana’s contrarian ETF performance compared to broader market trends. Bitcoin spot ETFs experienced $527 million in net capital withdrawals from June 29 through July 2 — marking their eighth consecutive week of negative flows. Ethereum spot ETFs shed $13.67 million over the identical timeframe.
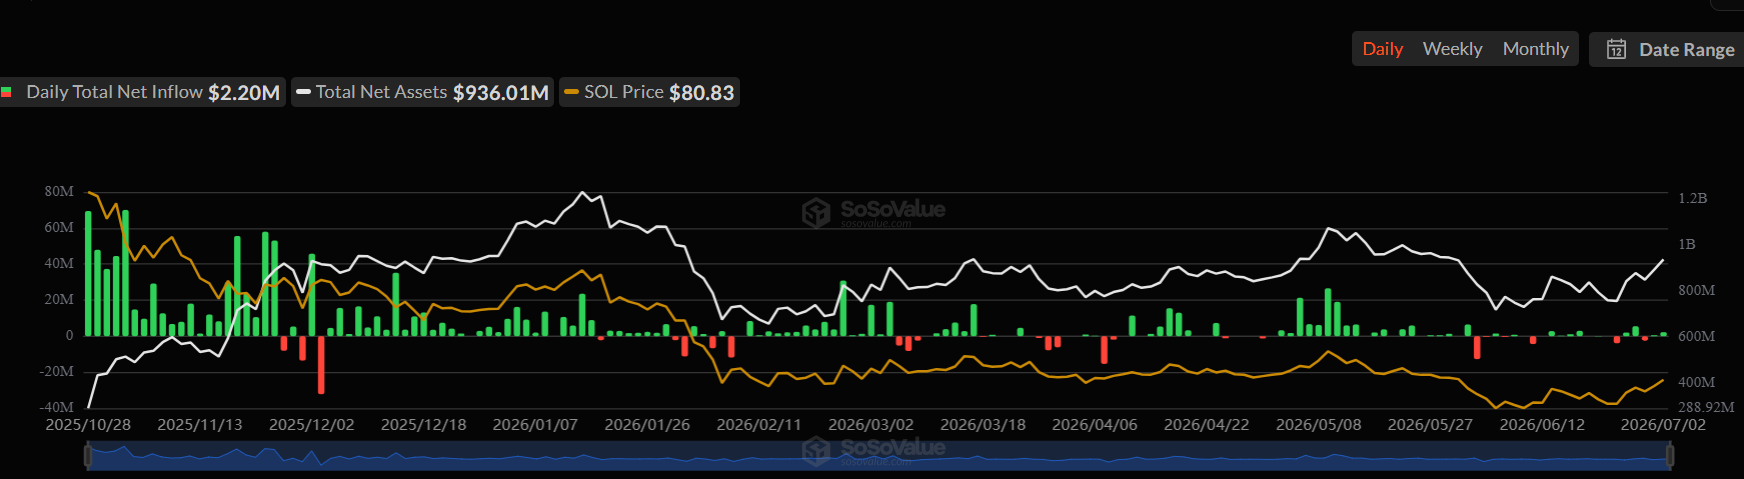
Solana bucked this trend entirely. U.S.-traded spot SOL ETFs captured $5.75 million in positive inflows. Meanwhile, XRP ETFs secured $17.19 million, and HYPE ETFs garnered $4.32 million.
Network Metrics Reach Unprecedented Heights
Blockchain utilization achieved a historic benchmark last week. SolanaFloor verified that weekly non-vote transactions exceeded one billion for the first time in the platform’s history. These represent actual user interactions, application usage, and trading activity — excluding validator consensus operations — establishing this as a significant indicator of authentic network engagement.

[[EMBED_0]]
Crypto analyst Michaël van de Poppe shared his perspective on Solana’s technical positioning. He noted the fundamental thesis for $SOL remains intact — the asset is re-entering its established range with an anticipated minor retracement before resuming upward momentum. He emphasized his preference to see the $75–$77 zone hold as support, projecting a potential advance toward $100 and possibly $120 throughout the forthcoming weeks and months.
[[EMBED_1]]
Active wallet addresses demonstrated explosive growth as well, surging from 16.8 million to 29.7 million over two weeks — representing approximately 76.8% expansion. Solana also captured the leading position among all Layer 1 and Layer 2 networks in both 24-hour and seven-day decentralized application revenue metrics, while dominating DEX volume across identical measurement periods. Polygon, Ethereum, Base, BNB Chain, and Hyperliquid trailed behind.
Technical Levels: $80 Support Versus $85 Resistance Zone
Regarding trading activity, Solana secured the second position globally for consecutive weeks, facilitating $12.25 billion in volume across both centralized and decentralized platforms. This performance exceeded Bybit’s $10.57 billion, although Binance retained the overall leadership position.
Examining the daily timeframe, SOL trades above its 20-, 50-, and 100-day exponential moving averages. The MACD indicator continues displaying bullish signals, despite momentum moderating following the previous week’s 15% surge.
The RSI on the four-hour timeframe registered near 51–53, indicating neutral directional bias. The Supertrend indicator positioned below price action around $78.30. Near-term resistance emerges around the $84–$85 area, while critical support levels at $78 and $76 represent important zones for market participants to monitor.
At publication time, the asset traded at approximately $80.34.
Get 3 Free Stock Ebooks
Discover top-performing stocks in AI, Crypto, and Technology with expert analysis.
- Top 10 AI Stocks - Leading AI companies
- Top 10 Crypto Stocks - Blockchain leaders
- Top 10 Tech Stocks - Tech giants



