



Key Highlights
- Ethereum maintains support above $1,600 following double-bottom formation near the $1,500 level
- Breaking above $1,800 on a daily timeframe may trigger a rally toward $2,160
- Technical indicators show strengthening momentum: RSI at 55.53 and expanding MACD histogram signal increasing buying activity
- Binance experienced $1.23 billion in net ETH outflows last week—the largest withdrawal surge in more than three years
- Development team unveils quantum-resistance strategy with implementation scheduled for 2029
Ethereum currently sits at $1,766 following an approximately 12.5% price increase over the past week. After bouncing from lows around $1,500, the asset is now testing a critical resistance threshold that market participants are monitoring carefully.
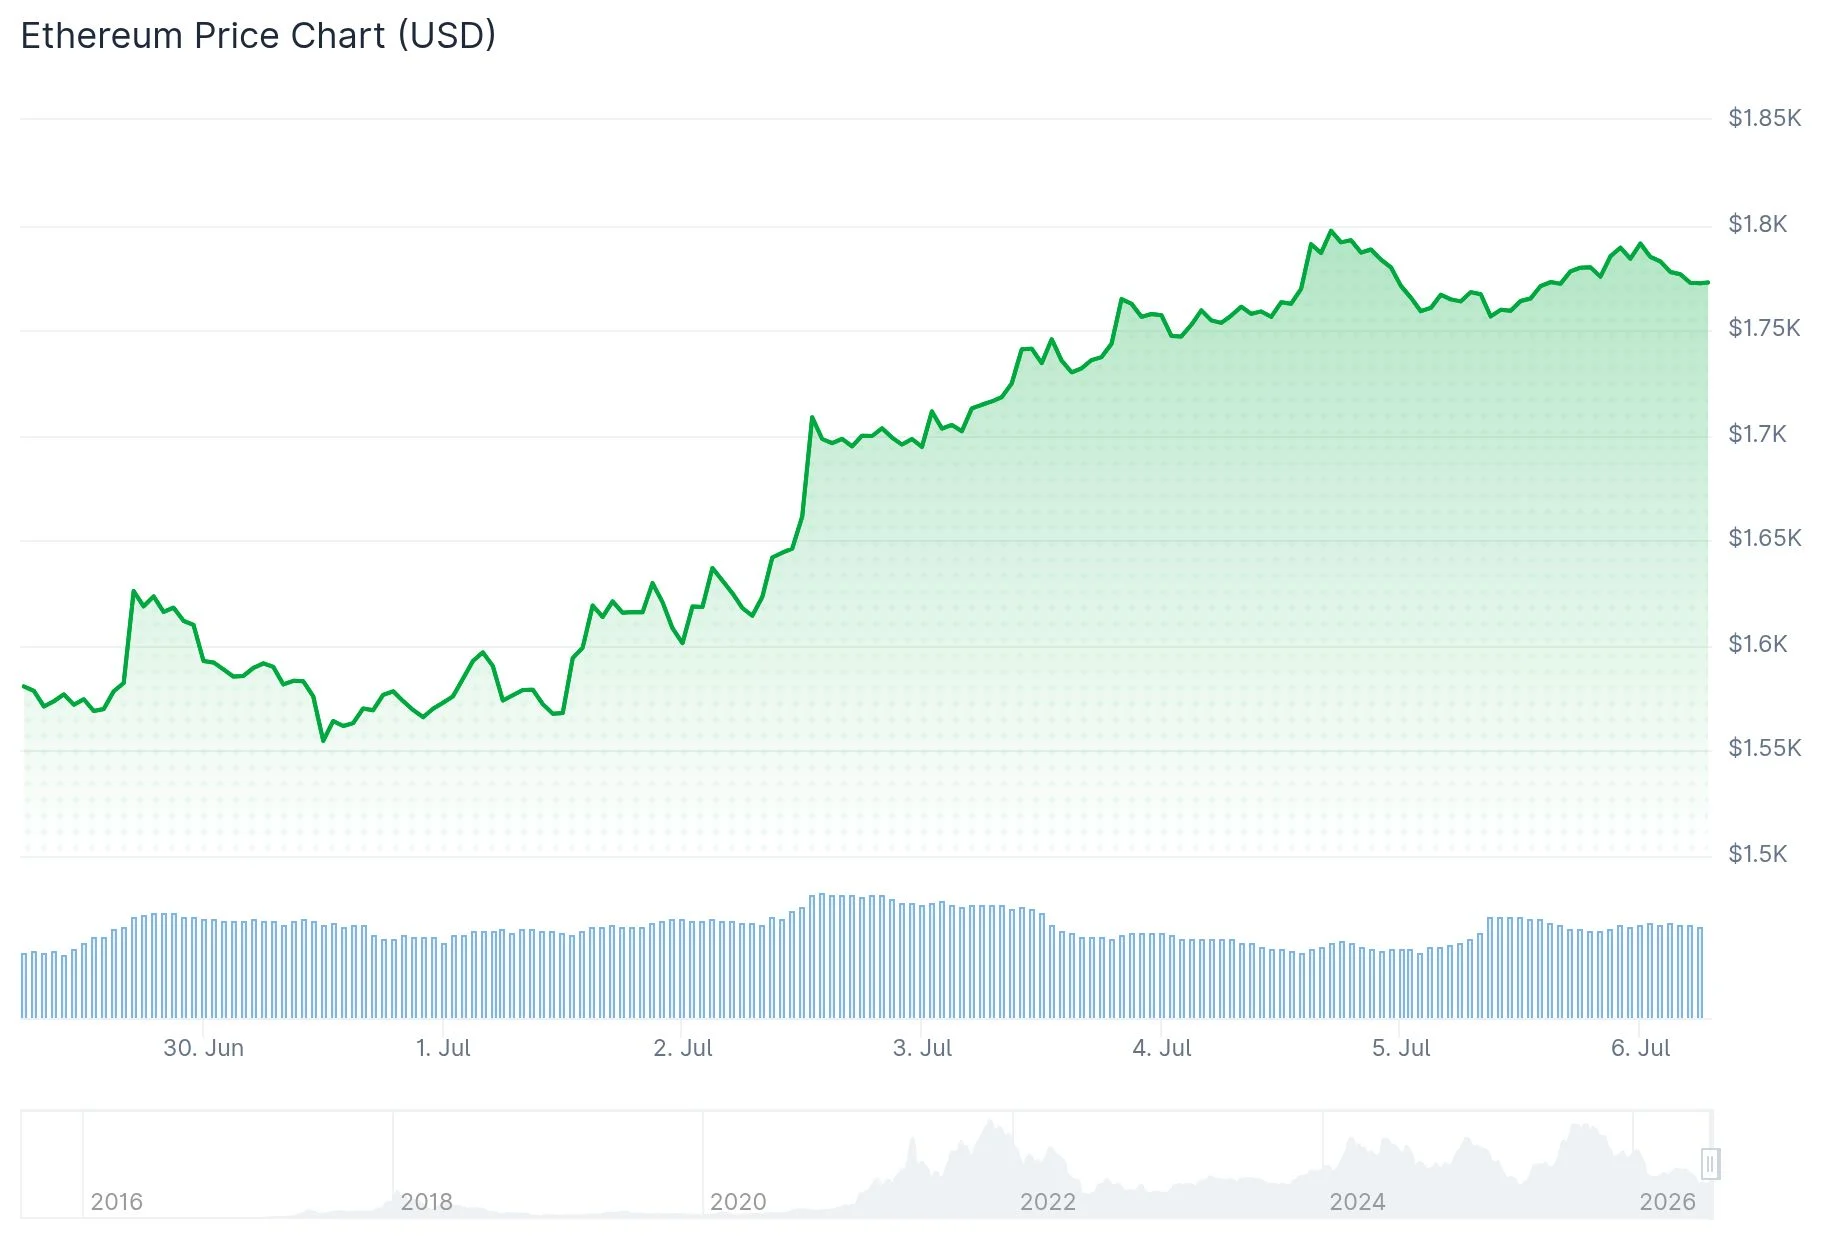
The cryptocurrency has carved out a double-bottom chart formation in the $1,500 region, a technical pattern that frequently indicates a transition from bearish to bullish sentiment. This recovery has brought the price to the $1,780–$1,800 neckline resistance area.
Market analyst Ted Pillows highlighted this critical zone on his social platform. According to his assessment, the $1,750–$1,800 range represents “probably the most important zone for $ETH” at this juncture. He observed that Ethereum has attempted multiple times in recent weeks to reclaim this territory but has encountered strong resistance on each occasion. Breaking decisively above this threshold, he suggested, would shift control from sellers to buyers.
Should ETH secure a daily candle close above $1,800, it would validate the bullish reversal structure and establish upside objectives at $1,900, $2,000, and potentially $2,160 based on the pattern’s measured projection. Conversely, failure to breach this resistance could result in a pullback toward $1,700 or the $1,600 support foundation.
Technical Indicators Reflect Strengthening Bullish Momentum
The Relative Strength Index has advanced to 55.53, crossing above the 50 midpoint and distancing itself from oversold conditions. Its moving average stands at 40.53, indicating the momentum shift remains in its early development phase.

The MACD indicator also displays bullish characteristics. The MACD line registers at -22.84, positioned above the signal line at -53.27. The histogram has widened to 30.43, demonstrating accelerating upward pressure.
While both metrics align in a positive direction, market observers emphasize that Ethereum must achieve a convincing close above $1,800 before a sustainable upward trend can be established.
Massive Exchange Withdrawals Suggest Accumulation Phase
Binance documented $1.23 billion in net ETH withdrawals during the week beginning June 29, representing a 207% increase from approximately $400 million the previous week. On a monthly basis, net outflows approached $3.2 billion.
CryptoQuant analyst Darkfost noted that Binance’s ETH withdrawal transaction count reached its highest point in over three years, exceeding 166,000 transactions within a 24-hour period. The last comparable spike occurred in March 2023.
According to Darkfost’s analysis, this withdrawal surge “could reflect genuine demand building around the $1,500 level, with investors choosing to pull their funds off the exchange”—behavior that generally indicates long-term accumulation strategies rather than short-term trading.
Withdrawal activity wasn’t limited to Binance. Bitfinex registered $407.5 million in outflows, Gate processed $214.3 million, and OKX documented $87.1 million during the same timeframe.
In related development news, Ethereum’s core development team has released a comprehensive roadmap addressing quantum computing threats, incorporating native STARK verification technology and alternative signature schemes to replace the current ECDSA standard, with full deployment anticipated by 2029.
Get 3 Free Stock Ebooks
Discover top-performing stocks in AI, Crypto, and Technology with expert analysis.
- Top 10 AI Stocks - Leading AI companies
- Top 10 Crypto Stocks - Blockchain leaders
- Top 10 Tech Stocks - Tech giants



