
 Rallies 23% From June Bottom — Will $80 Resistance Hold Firm?")
TLDR
- Approximately 600,000 SOL tokens have recently moved onto centralized trading platforms, suggesting potential selling pressure or hedging activity.
- Crypto analyst Ali Charts identified a TD Sequential sell signal on the 4-hour timeframe, with key resistance positioned at $74.65 and the 200 SMA near $75.
- SOL currently hovers around $74, marking a roughly 23% climb from its June bottom of $60.
- The $73 price point serves as a critical threshold — maintaining levels above this supports the ongoing recovery narrative.
- Market watchers are eyeing $80–$82 as the next major resistance barrier, while $50 represents significant downside support.
Solana (SOL) is currently changing hands near $74 following a nearly 23% rebound from its June nadir of $60. This recovery comes after a steep correction earlier in the month that drove prices significantly beneath a support level that had remained intact for several months.
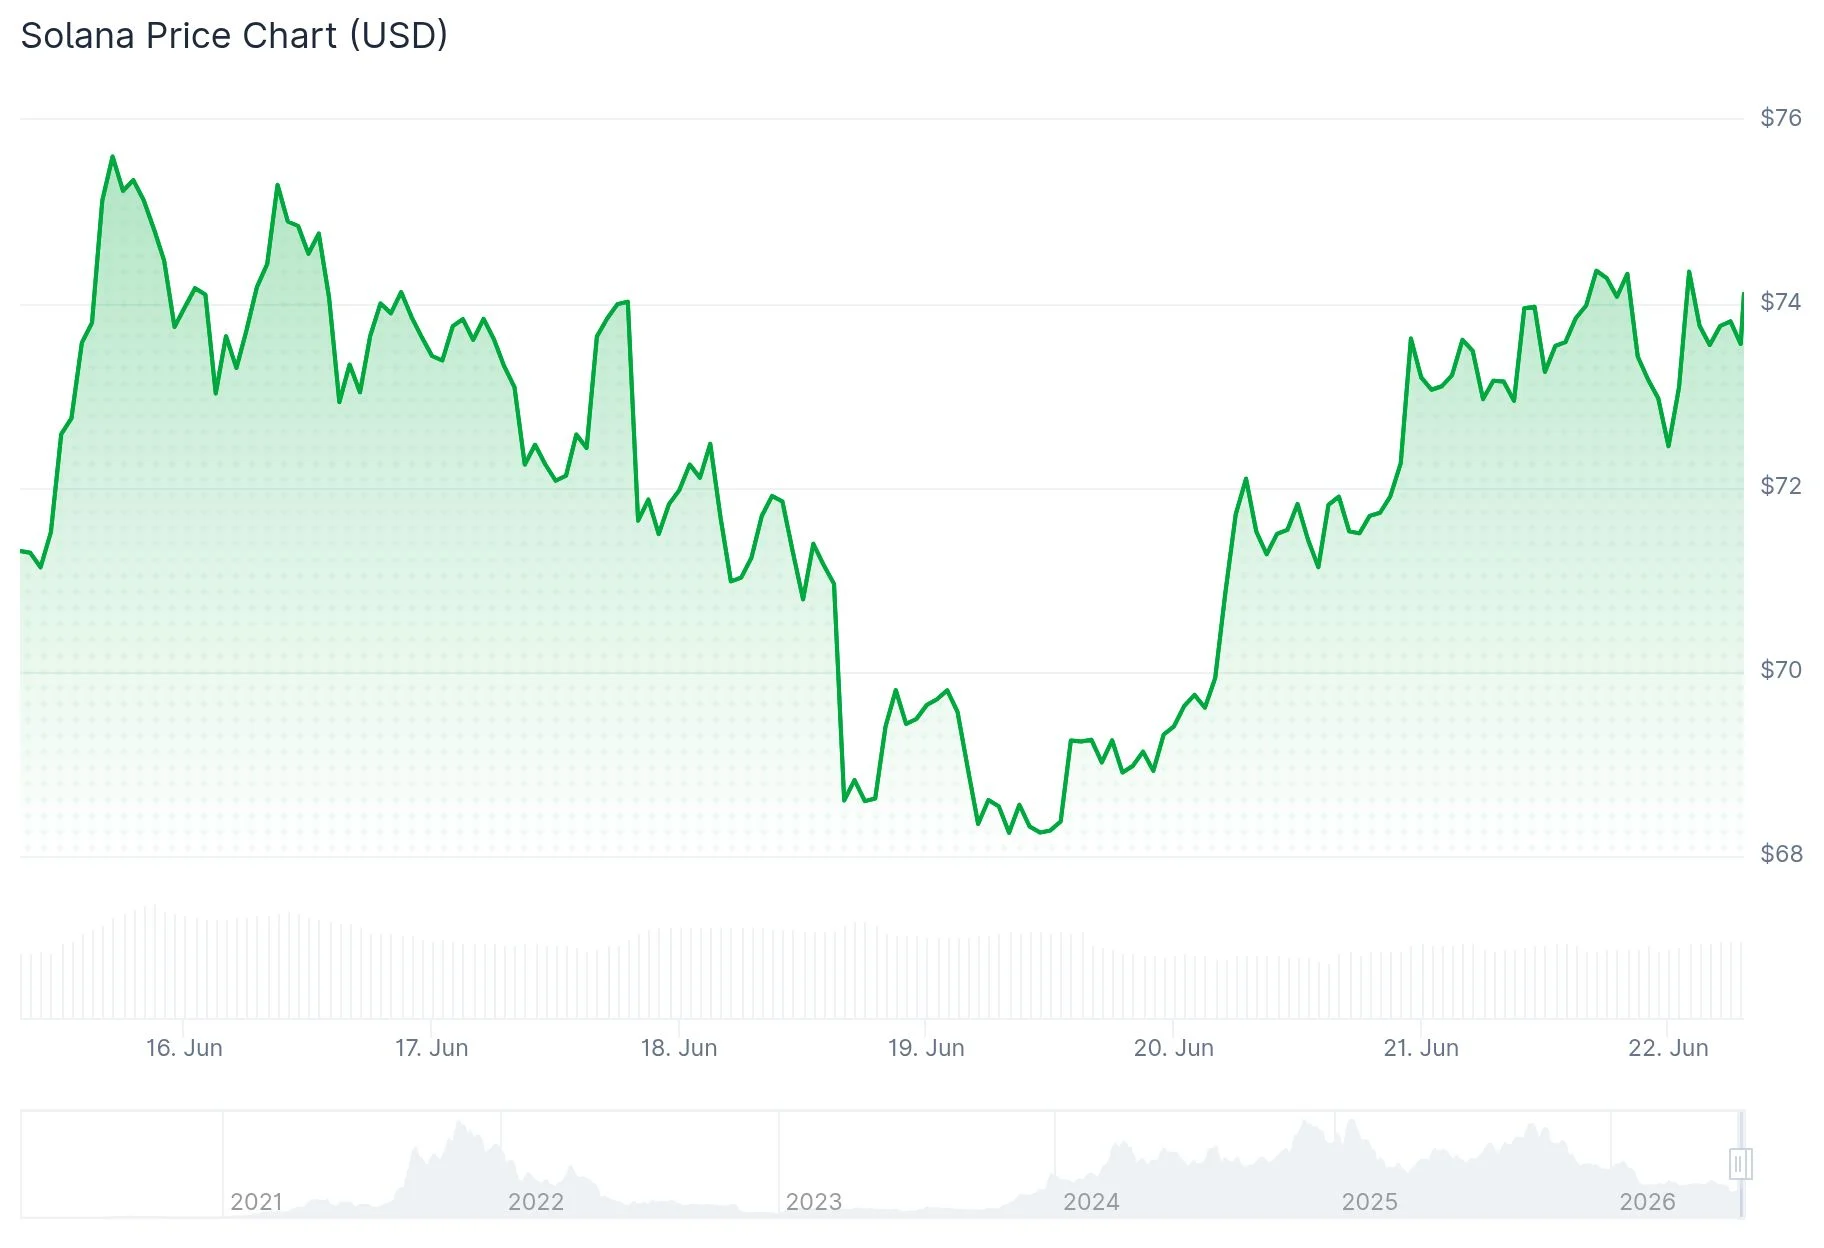
SOL’s 24-hour trading volume stands at $1.89 billion, accompanied by a market capitalization of $42.96 billion. The cryptocurrency registered a 3.08% increase over the past day.
Cryptocurrency analyst Ali Charts shared on X that after a TD Sequential buy signal triggered last Friday, SOL surged 8.40% from $68.46 to reach a peak of $74.27. Nevertheless, Ali Charts also pointed out that a fresh sell signal has emerged on the 4-hour chart, with price action now confronting resistance at $74.65. This zone coincides with the 4-hour 200 simple moving average at $75, creating what Ali Charts characterized as a “densely packed technical barrier.” Should price retreat from this area, initial targets could include $71, with a deeper retracement potentially reaching back to $68.46.
In addition, approximately 600,000 SOL tokens have recently been deposited to centralized exchanges, based on Ali Charts’ blockchain data analysis. Substantial inflow events of this magnitude frequently indicate that holders are positioning to liquidate holdings or establish protective positions, potentially generating near-term downward pressure.
Critical Price Zones Under Observation
Between February and May, the $73 level functioned as Solana’s primary floor. When price action broke beneath this threshold in June, it transformed into overhead resistance. A daily candle close above $74 would imply the June breakdown was merely a false signal. Inability to maintain current levels could trigger a retreat toward $60.

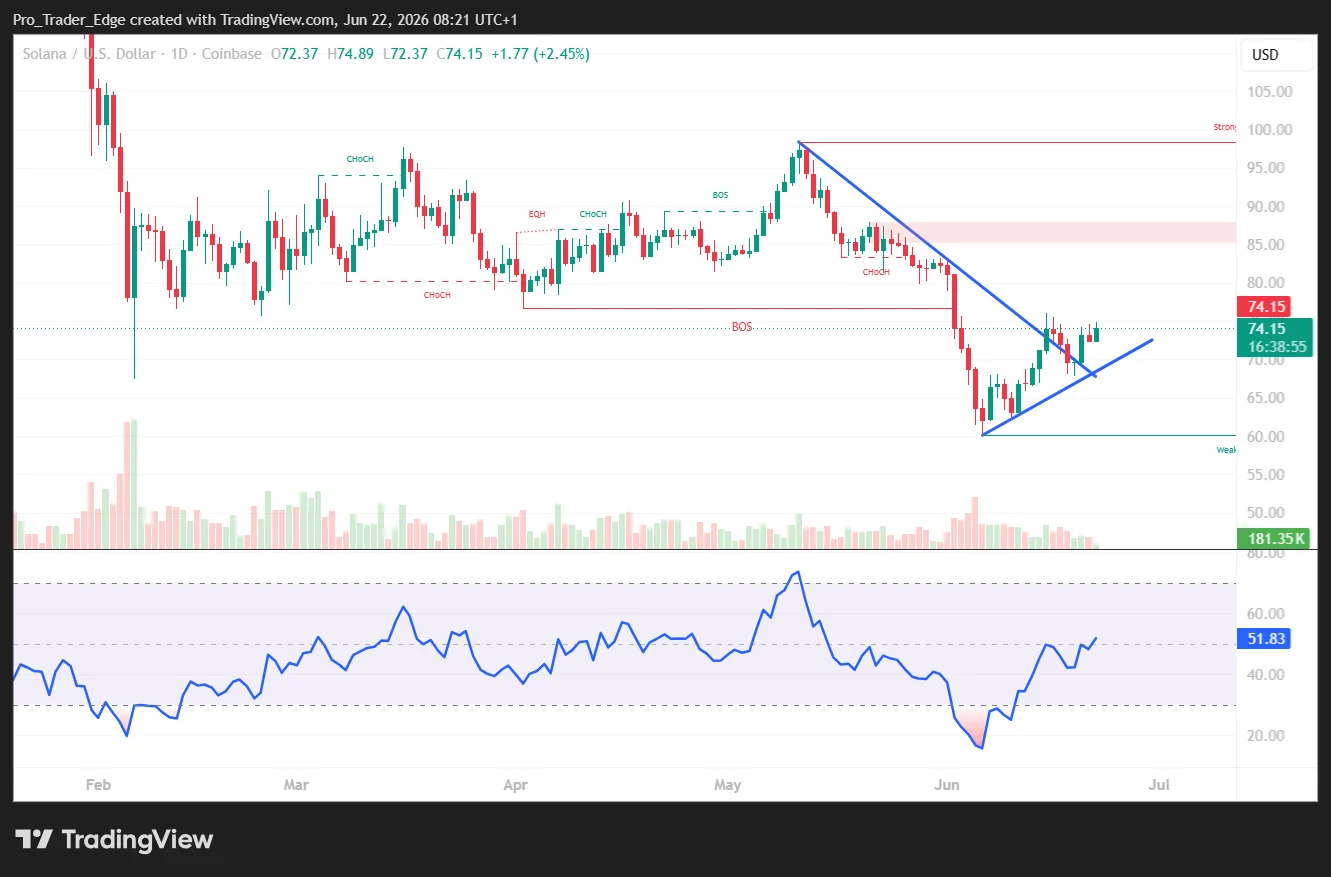
The RSI indicator plummeted to approximately 21 during June’s selloff, indicating severely oversold conditions. It has since rebounded to 48.45, with its signal line positioned at 39.77. Market observers note this configuration may precede a decisive directional breakout.
Analyst BitGuru emphasized that SOL rebounded from a significant reversal area where selling pressure had previously been dominant. Buying interest has subsequently emerged and stabilized price movement, which BitGuru interprets as behavior consistent with accumulation rather than the beginning of an extended bearish phase.
Analyst Altcoin Sherpa has recommended proceeding with caution, stating SOL remains “trash on high time frames” until it can demonstrate a structural transformation. He is awaiting a definitive recapture of $77 before entertaining long position entries.
Overhead Barriers and Downside Cushions
The 50-day simple moving average is positioned at $79.85, a level that has tracked Solana’s trajectory since February. Breaking above this threshold would bring $90 into focus.
Analyst EliZ is tracking the $82–$90 weekly supply area, characterizing it as potentially flipping from resistance to support. He maintains a constructive outlook on Solana’s ecosystem but awaits broader market confirmation before increasing conviction.
Should the present recovery falter and price slips beneath $73, the subsequent zone of interest lies in the $67–$68 band. A daily close under $60 would completely negate the bullish recovery hypothesis, with $50 identified as a substantial support benchmark further below.
SOL is presently challenging resistance around $74.65, with the 4-hour sell signal and exchange deposit activity suggesting possible near-term consolidation before the next significant directional move materializes.
Get 3 Free Stock Ebooks
Discover top-performing stocks in AI, Crypto, and Technology with expert analysis.
- Top 10 AI Stocks - Leading AI companies
- Top 10 Crypto Stocks - Blockchain leaders
- Top 10 Tech Stocks - Tech giants


