
 Slides Under $65 as Technical Signals Point to Potential $77 Recovery")
Key Takeaways
- SOL has fallen below the $65 mark and remains trapped beneath its 50-, 100-, and 200-day moving averages, signaling continued bearish pressure.
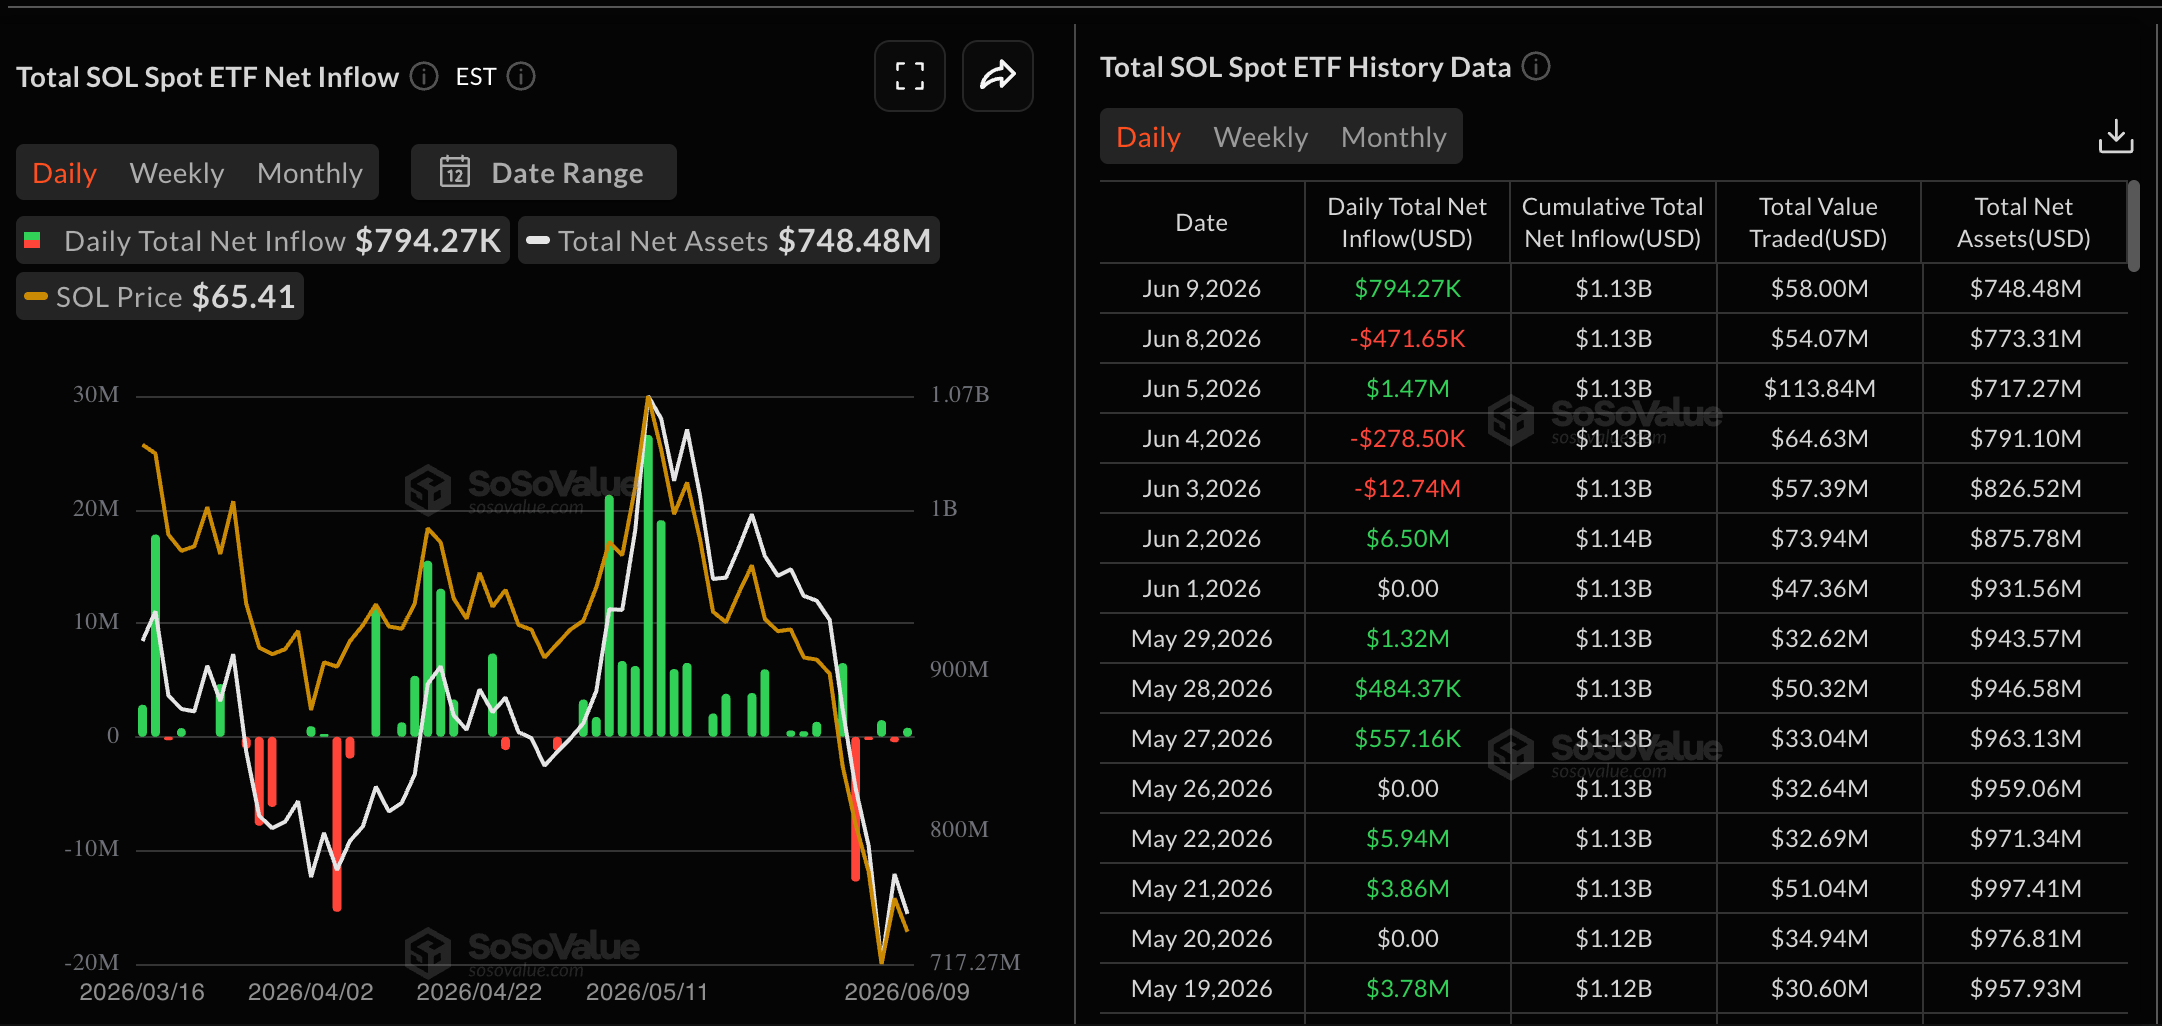
- Solana ETFs recorded inflows of $794,270 on Tuesday, but this follows a prior week that saw $6.52 million exit the funds, reflecting inconsistent institutional appetite.
- Futures Open Interest has contracted to approximately $4.41–$4.57 billion from a high near $17 billion, indicating reduced trader leverage and caution.
- Exchange activity has turned slightly positive since March, with recent net inflows hinting at emerging accumulation despite the prevailing downtrend.
- Technical analyst Ali Charts has identified a TD Sequential buy indicator on SOL’s chart, suggesting a potential rally toward the $77 resistance zone.
Solana continues to face sustained downward pressure, with Wednesday’s price action offering little relief for bulls. Currently hovering between $64 and $66, SOL remains deeply entrenched below critical technical thresholds, and the road to recovery appears laden with obstacles.
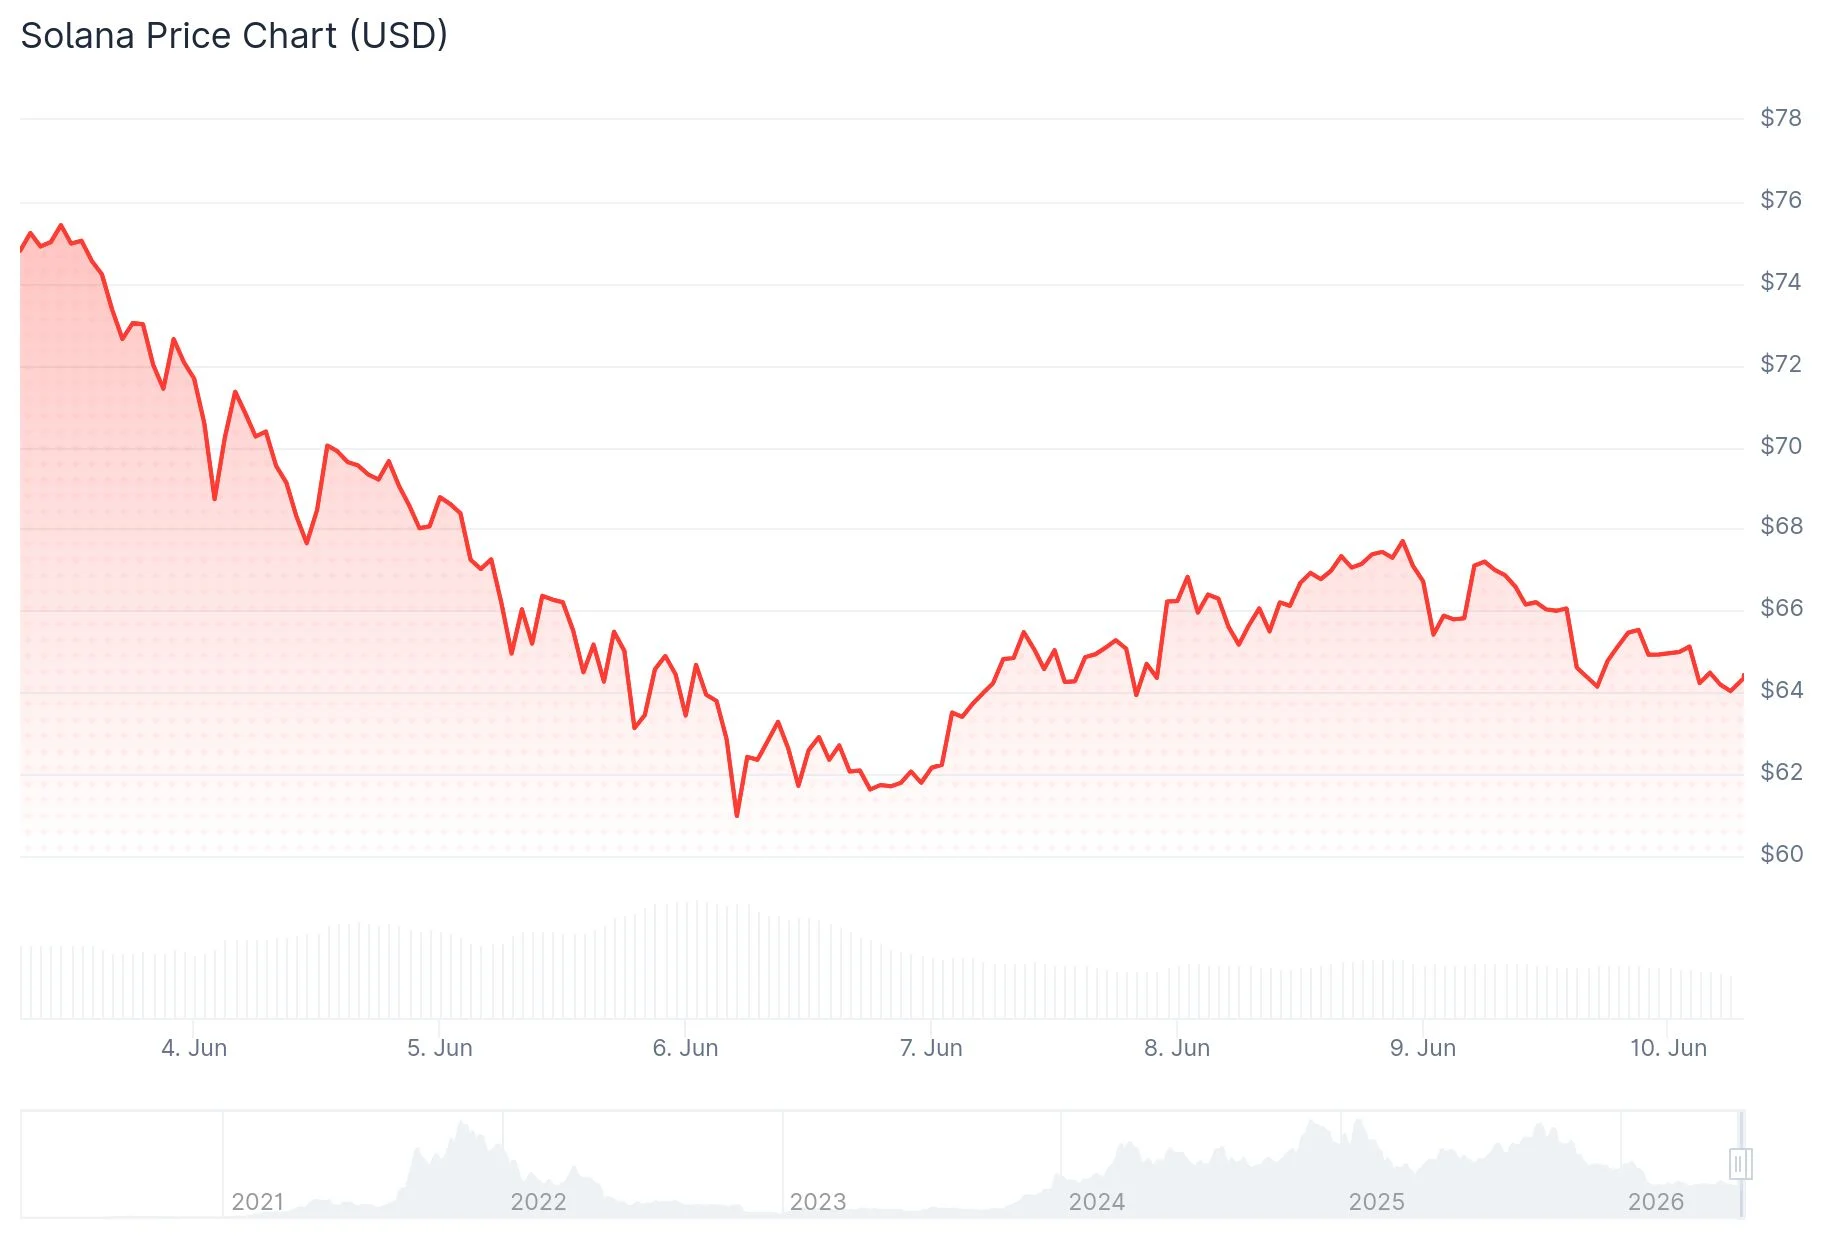
The digital asset found temporary relief after touching lows near $60.13 over the weekend, staging a modest rebound. However, that upward momentum has since faded. SOL continues to trade below its 50-day exponential moving average at $80.25, its 100-day EMA at $87.22, and its 200-day EMA at $102.96. This configuration reinforces the entrenched bearish structure dominating the market.
Nearby support rests at $65.59, coinciding with the 0.236 Fibonacci retracement. Should that level fail, traders are eyeing a demand zone spanning $63 to $64, with the pivotal swing low at $60.13–$60.17 serving as the next major line of defense. A breach of that floor would turn attention to $59.11, a level last visited in December 2023. Further deterioration could expose the $51.28 area, dangerously close to the psychologically significant $50 threshold.
Institutional Demand Remains Uncertain
On the institutional front, Solana-focused exchange-traded funds attracted $794,270 in net inflows on Tuesday. This followed outflows of $471,650 the previous session. Taking a broader view, however, the preceding week witnessed total outflows of $6.52 million. This erratic flow pattern underscores wavering institutional confidence in the asset at present.
Retail engagement has similarly declined. Funding rates, which sat at a negative -0.0325% on Sunday, have normalized to approximately -0.0042% by Wednesday, indicating that leverage-driven selling pressure has diminished. Nevertheless, Open Interest across SOL futures contracts fell roughly 2% over the last 24 hours to $4.41 billion. Notably, long liquidations accounted for $8.29 million of the total $11.36 million in liquidations during this period, underscoring persistent weakness among bullish positions.

Futures Market Shows Cautious Positioning
Open Interest climbed to nearly $17 billion earlier this year during Solana’s bull run. Since that peak collapsed, the metric has stabilized within a tighter range between approximately $4.5 billion and $6 billion. The current reading around $4.57 billion suggests market participants remain engaged but are exercising restraint when it comes to adding leveraged exposure.
Spot exchange data paints a marginally more optimistic picture. Since the beginning of March, inflow and outflow patterns have achieved better equilibrium, with several recent trading sessions recording modest net inflows. This activity hints at gradual accumulation taking place beneath the surface, though a definitive trend reversal has yet to emerge.
Technical Indicator Points to Possible Reversal
Cryptocurrency analyst Ali Charts shared on X that a TD Sequential buy signal has materialized on the Solana chart. “If it plays out, a move to the $77 resistance cluster could be next,” the analyst noted. This projection aligns with the technical framework — a push above $67.50 could pave the way toward $75.63, with the 50-day EMA near $80.25 representing the next major hurdle.
The Relative Strength Index currently sits around 26, firmly in oversold territory. While this reading does not guarantee an imminent reversal, it does indicate that selling momentum may be reaching exhaustion.
On the resistance side, the $68.94–$69.48 zone remains the critical area bulls must reclaim to catalyze a shift in market sentiment.
Get 3 Free Stock Ebooks
Discover top-performing stocks in AI, Crypto, and Technology with expert analysis.
- Top 10 AI Stocks - Leading AI companies
- Top 10 Crypto Stocks - Blockchain leaders
- Top 10 Tech Stocks - Tech giants


