

Key Takeaways
- XRP breached the $1.15 threshold and 100-hour moving average following a breakdown of $1.1620 support
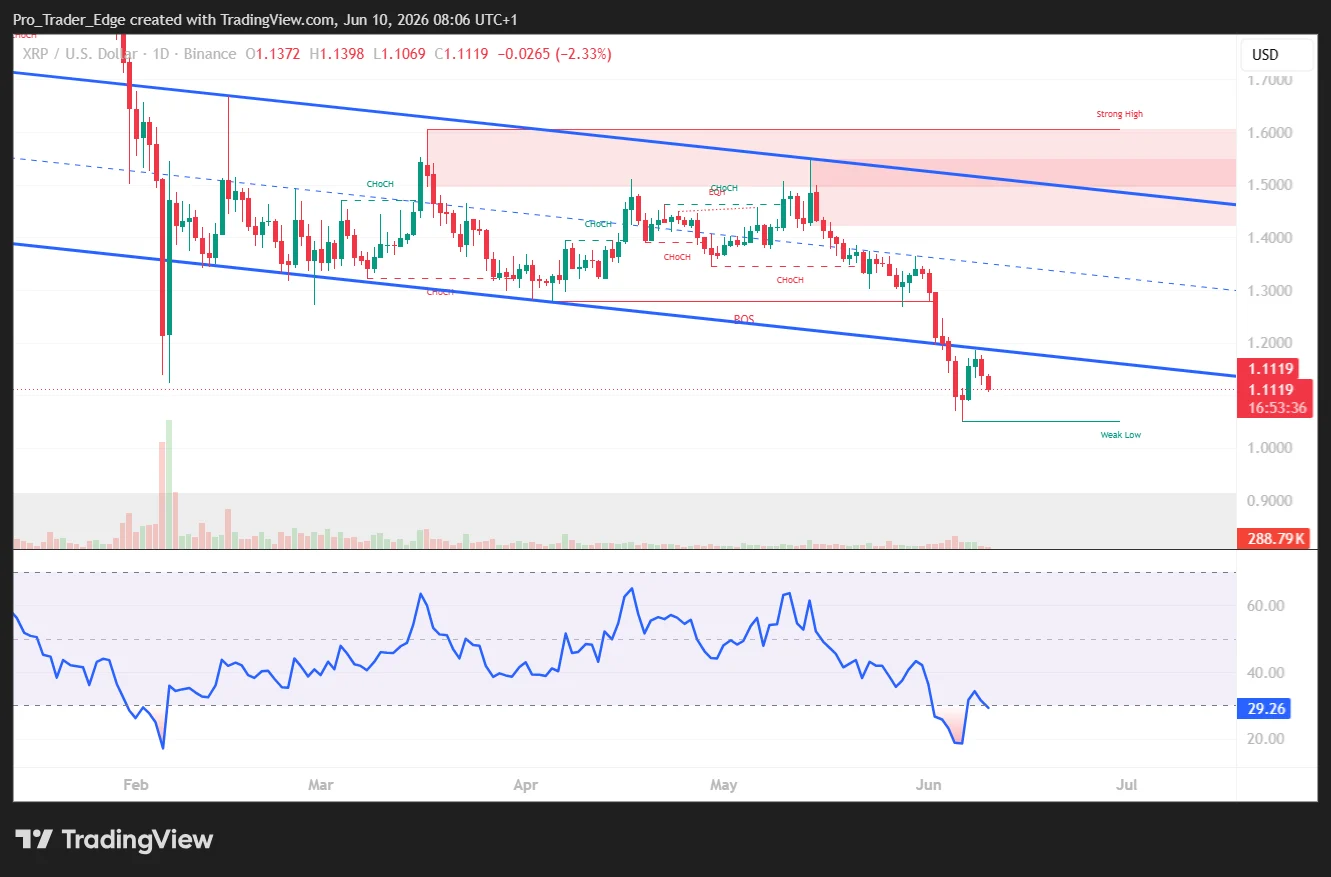
- Technical indicators show bearish momentum with MACD negative and RSI hovering at 32.83 near oversold territory
- Crypto analyst EGRAG Crypto identifies $1.40 monthly close as essential validation for the double bottom formation at $1.05
- Breaking below $1.14 could trigger further declines toward $1.10, $0.90, or potentially $0.80
- XRP Ledger version 3.2.0 launches June 15, bringing core server rebranding from rippled to xrpld
On June 10, 2026, XRP experienced a notable decline, sliding beneath the $1.15 mark after struggling to maintain a crucial support zone that had provided stability in previous trading sessions. This downturn followed a breakdown of a bullish trend line formation on the hourly timeframe around the $1.1620 level.
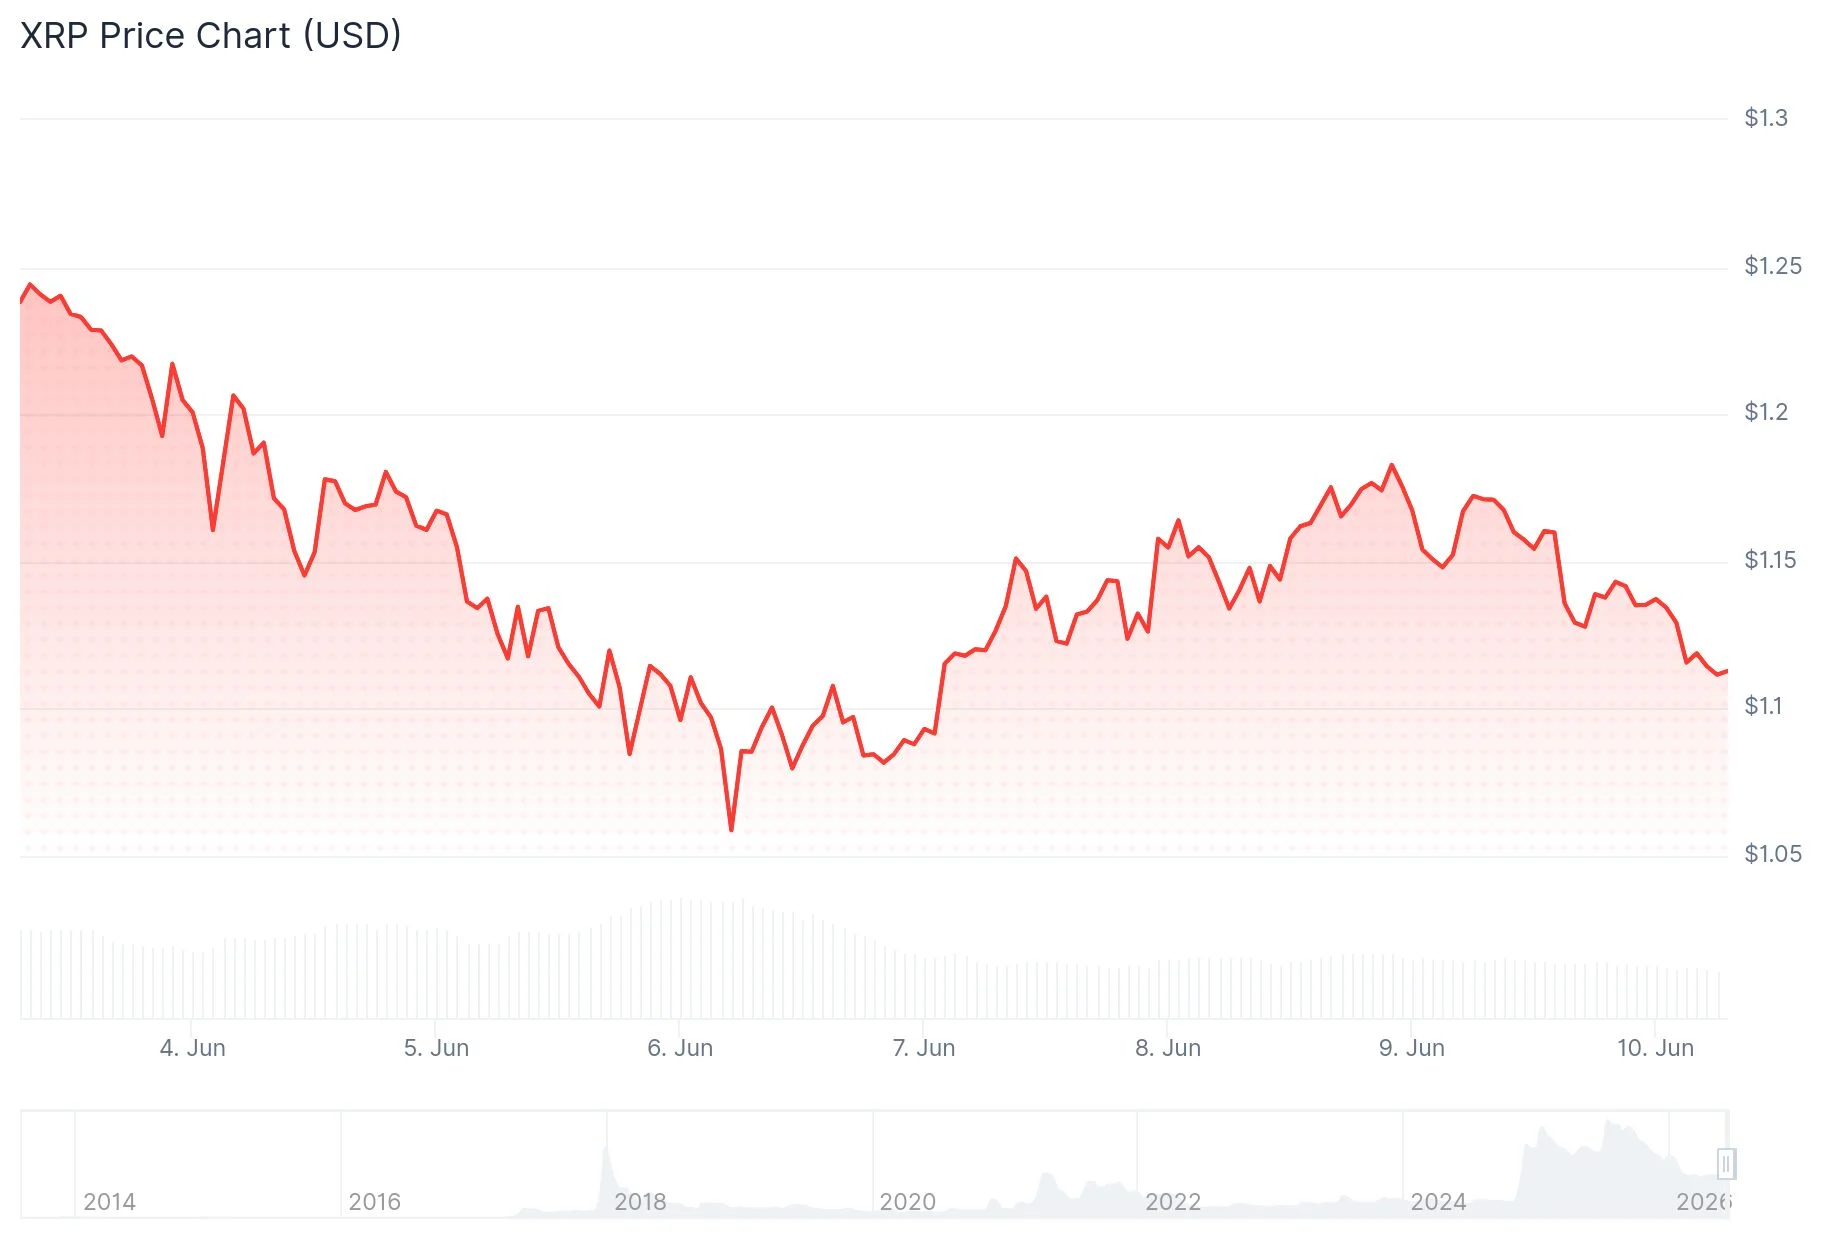
The digital asset had previously bounced from a local bottom of $1.05 earlier in the month, climbing to a peak of $1.1863. However, this upward movement proved short-lived and quickly dissipated. Currently, XRP is positioned beneath its 100-hour simple moving average, signaling near-term weakness.
The seven-day performance shows XRP declining approximately 8%, while the monthly chart reveals a more significant 19% retreat. The token’s market capitalization currently sits around $71.8 billion, accompanied by daily trading activity of approximately $2.17 billion.
Critical Resistance Zones Ahead for XRP
For bulls to regain control, XRP must first overcome immediate resistance at $1.135 and $1.142. Successfully reclaiming the $1.15 level would pave the way toward $1.158 and $1.165. Beyond these levels, major resistance awaits at $1.1840.
Looking at potential downside targets, the 61.8% Fibonacci retracement from recent swings is positioned near $1.102. Below this technical marker, $1.10 represents another significant support zone. A definitive break beneath $1.10 could accelerate selling pressure toward $1.08, with a possible retest of the $1.05 swing low.

Crypto analyst EGRAG Crypto observed XRP’s approach to $1.1860 before the reversal occurred. His analysis states: “Short-term target remains: $1.19–$1.25,” while cautioning that failure to defend $1.14 could result in a retreat to $1.10.
Meanwhile, analyst Ali Martinez highlighted XRP’s proximity to a long-term ascending trend line that has provided support throughout various market cycles. He identified a demand zone spanning $0.70 to $0.90 as a potential accumulation area should current support levels fail to hold.
Bearish Technical Signals Dominate
The MACD indicator continues trading beneath its signal line, with the histogram displaying negative values. Meanwhile, the RSI stands at 32.83, hovering just above the oversold boundary of 30.
Open interest on Bybit contracted by 36% throughout the recent price correction. Binance trading volume similarly declined below its 30-day moving average following the downturn, indicating reduced appetite for leveraged exposure among traders.
Data from Santiment reveals XRP’s 30-day Market Value to Realized Value (MVRV) ratio near -8%, suggesting that most recent purchasers are currently underwater on their positions.
Market observers have identified two substantial sell walls positioned between the current price level and $1.34, which may impede any immediate recovery efforts.
The scheduled XRP Ledger 3.2.0 upgrade is set for deployment on June 15. This significant update includes rebranding the core server software from its original rippled designation to xrpld, along with optimizations for reduced memory consumption and enhanced performance metrics. Comprehensive benchmarking results remain forthcoming.
Get 3 Free Stock Ebooks
Discover top-performing stocks in AI, Crypto, and Technology with expert analysis.
- Top 10 AI Stocks - Leading AI companies
- Top 10 Crypto Stocks - Blockchain leaders
- Top 10 Tech Stocks - Tech giants


