
 Crashes Through Critical Support — What Comes Next?")
Key Takeaways
- XRP has crashed through its consolidation floor after holding for four months, currently trading between $1.16 and $1.18 with a 24-hour decline exceeding 6%.
- The critical $1.26–$1.28 support zone that remained intact throughout March and April has now given way.
- All major moving averages are positioned above current price action, including the 200-day EMA above $1.60, indicating sustained bearish momentum.
- Should the $1.14–$1.18 support zone fail, technical analysts have identified potential downside objectives at $0.92 and as low as $0.63.
- The Relative Strength Index has plummeted to approximately 24, entering oversold conditions, though broader indicators maintain bearish signals.
XRP has decisively broken beneath a consolidation pattern that persisted for approximately four months. Current trading activity places the asset around $1.16–$1.18, significantly lower than the range bottom that remained resilient throughout the spring months.
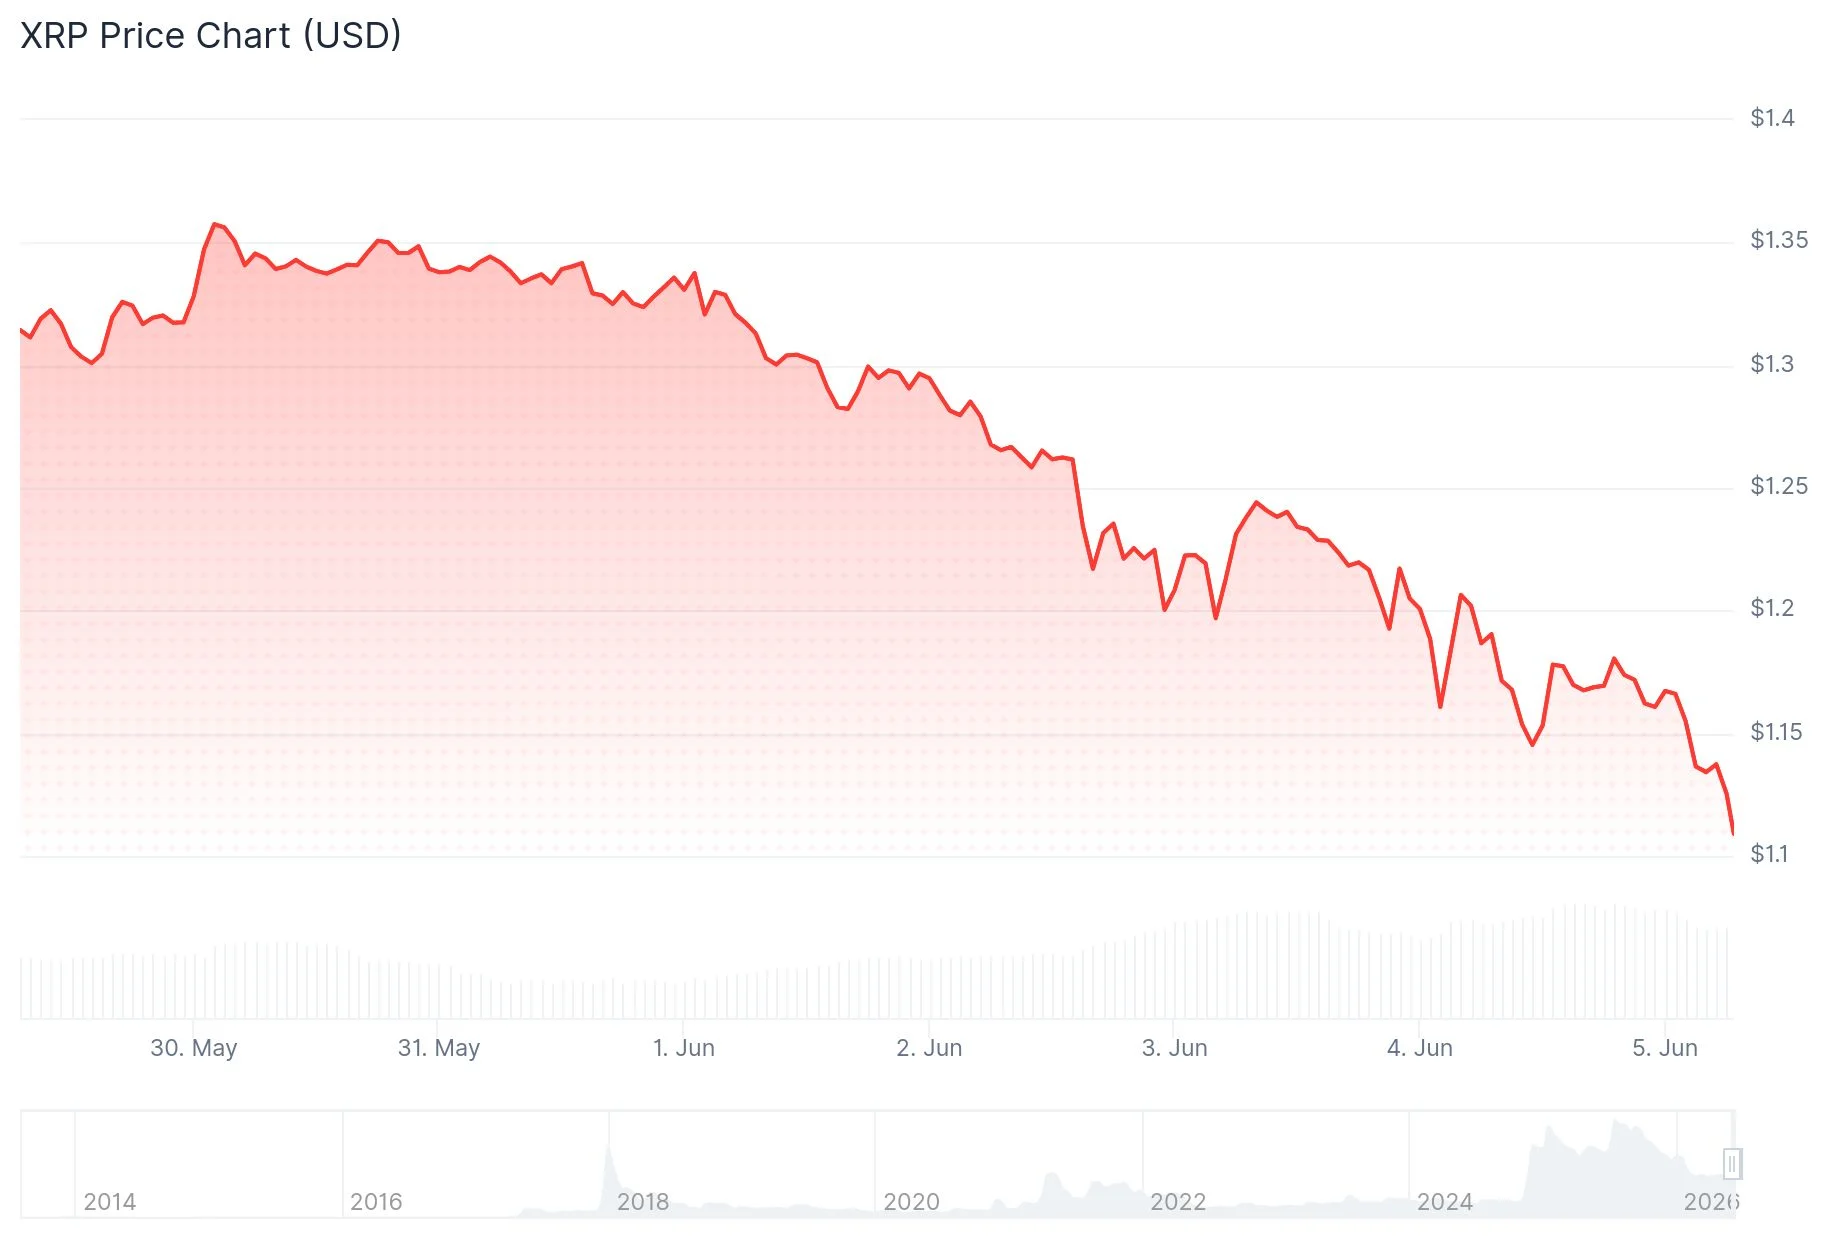
The established trading range featured a top boundary near $1.55 and a bottom anchored between $1.26 and $1.28. This foundational support has now been violated, with XRP experiencing approximately 6.1% depreciation within a 24-hour window.
Market analyst “Guy on the Earth” shared technical charts on X displaying XRP hovering near $1.279 — positioned directly at the range boundary — prior to additional downward movement. His technical assessment pinpointed $1.10 as the initial downside objective following the loss of that critical support, a price point that corresponds with the wick bottom from early February.
Current market behavior suggests this projection is materializing. XRP has already penetrated below the range foundation, positioning the $1.10 target within striking distance.
Moving Average Analysis Reveals Bearish Structure
The technical landscape presents overwhelmingly bearish characteristics. XRP is presently positioned beneath virtually every significant moving average. The 10-day exponential moving average resides around $1.27, the 50-day EMA stands near $1.36, and the 200-day EMA exceeds $1.60. Technical analysts suggest a sentiment reversal would require XRP to recapture the $1.30 threshold accompanied by substantial volume.

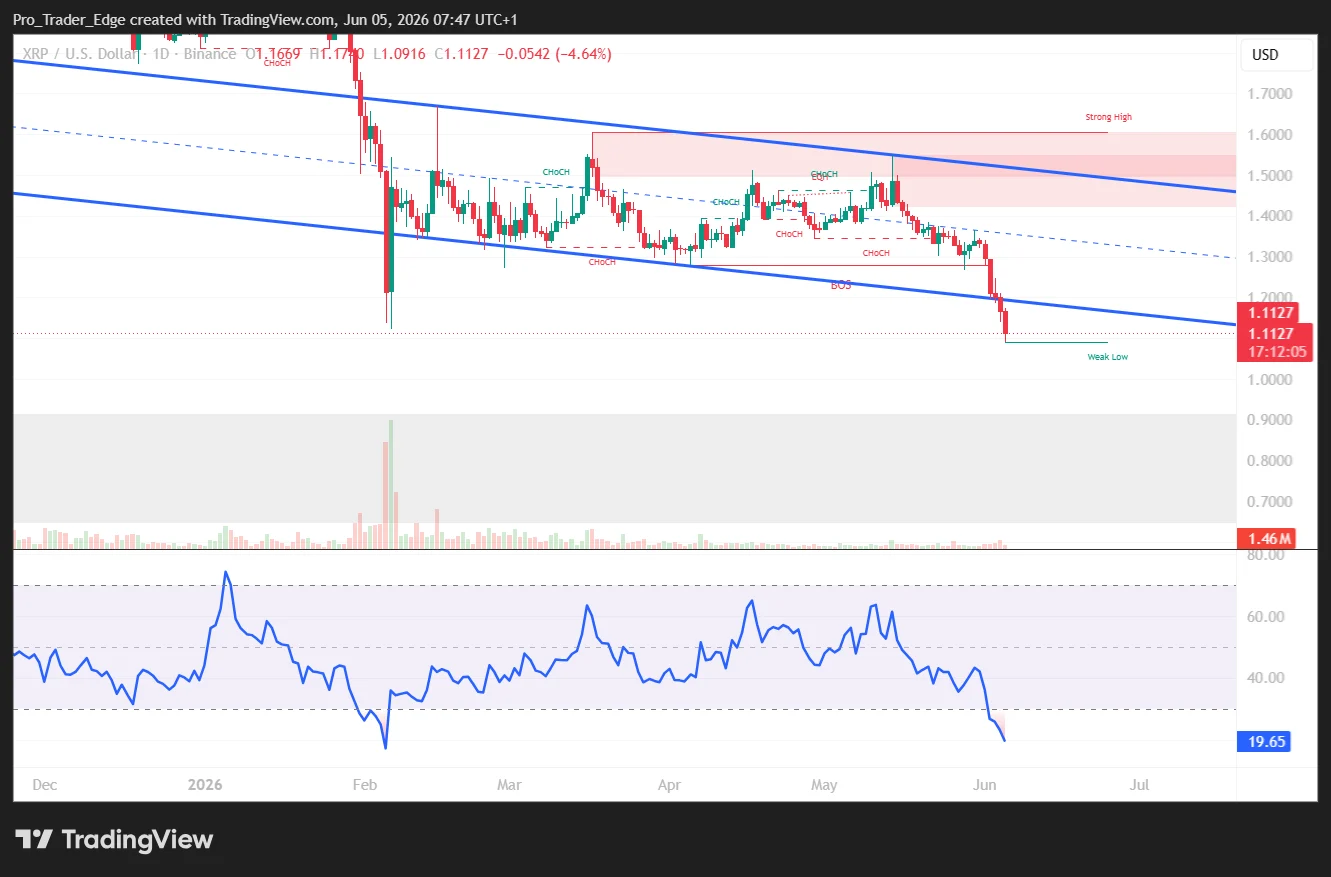
The comprehensive TradingView technical assessment trends neutral-to-bearish, with moving average indicators producing the most pronounced sell signals.
Potential Downside Objectives Under Scrutiny
Analyst Crypto Patel, sharing perspectives via X, characterized the $1.10–$1.30 range as an active accumulation territory. He indicated that a breakdown from this zone could establish the $0.65–$0.85 range as a significant buying opportunity.
Analyst “Guy on the Earth” positioned the most probable bottom formation between $0.75 and $0.95 during a continued breakdown scenario, with an extreme downside level approaching $0.63 — a threshold that would erase the majority of XRP‘s appreciation since the final quarter of 2023.
Additional technical work from trader Blacksea highlighted on X that XRP appears to be replicating the identical falling wedge configuration it developed in 2024, immediately preceding a substantial price movement. Blacksea observed this pattern has historically correlated with aggressive reversals, although present price behavior has not yet validated any breakout.
A Fibonacci retracement measurement near $0.92 aligns with a heavily monitored support corridor between $0.87 and $0.92. Pivot point calculations similarly emphasize $1.097 as an immediate downside level and $0.811 as extended support.
The 14-period RSI has declined to approximately 24.26, registering below the oversold benchmark of 30. The Commodity Channel Index registers around -232. Daily volume continues exceeding $3 billion, demonstrating sustained market participation in XRP.
At the time of publication, XRP was changing hands at approximately $1.17.
Get 3 Free Stock Ebooks
Discover top-performing stocks in AI, Crypto, and Technology with expert analysis.
- Top 10 AI Stocks - Leading AI companies
- Top 10 Crypto Stocks - Blockchain leaders
- Top 10 Tech Stocks - Tech giants


