
 Price Alert: Crypto Analyst Forecasts Potential Drop to $0.84")
Key Takeaways
- XRP slipped beneath the $1.20 threshold and recorded a session low at $1.1401.
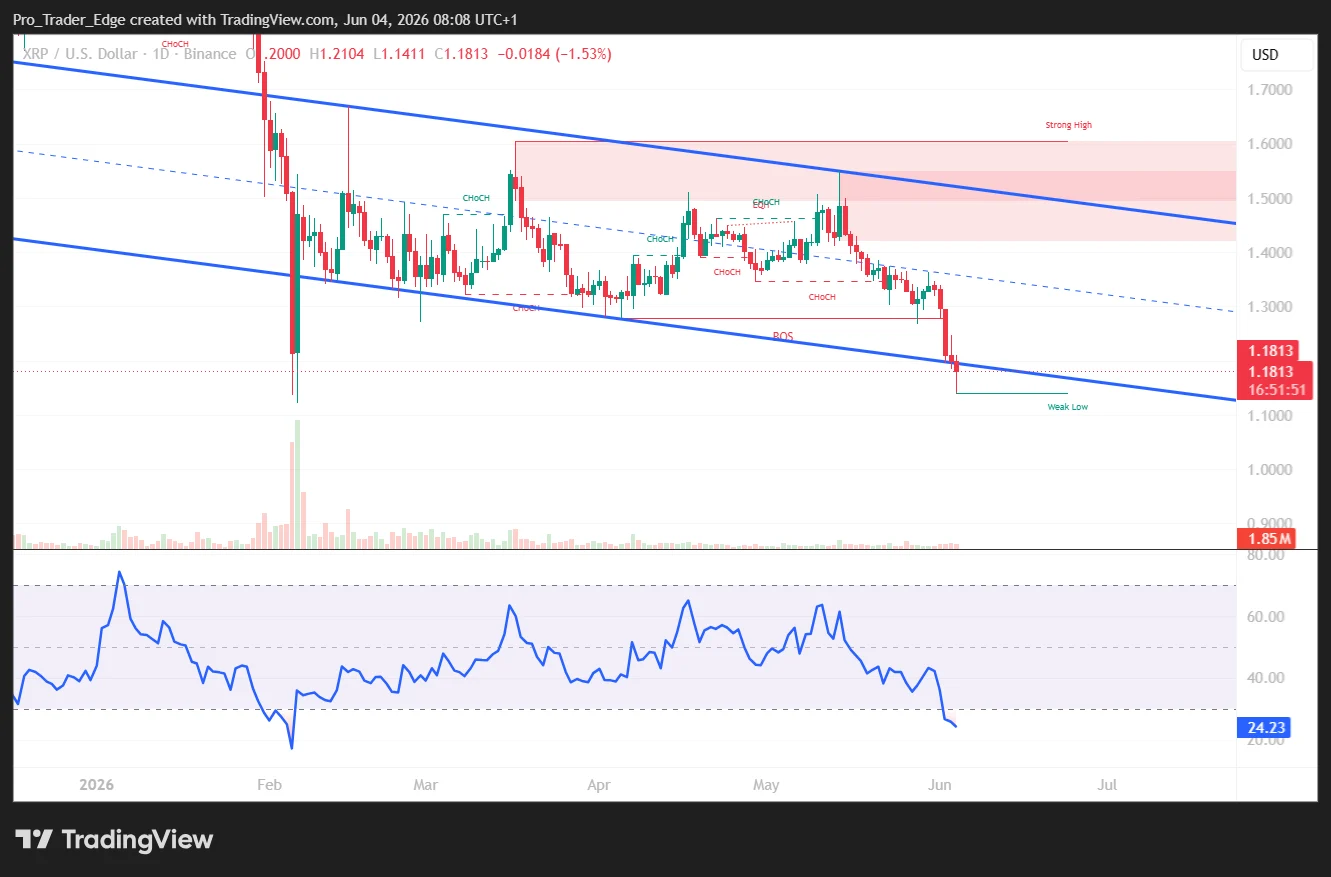
- Trading activity remains below the 100-hour Simple Moving Average, signaling bearish momentum in the short term.
- Relative Strength Index readings suggest oversold territory, potentially setting up a minor rebound.
- A decisive break above $1.1950 is necessary for bulls to regain control, with $1.32 representing the critical resistance barrier.
- Crypto analyst ChartNerd forecasts a possible decline to $0.84 Middle Regression Band should current support levels fail.
XRP has experienced consistent downward pressure throughout recent sessions, declining in tandem with Bitcoin and Ethereum as part of a wider cryptocurrency market correction.
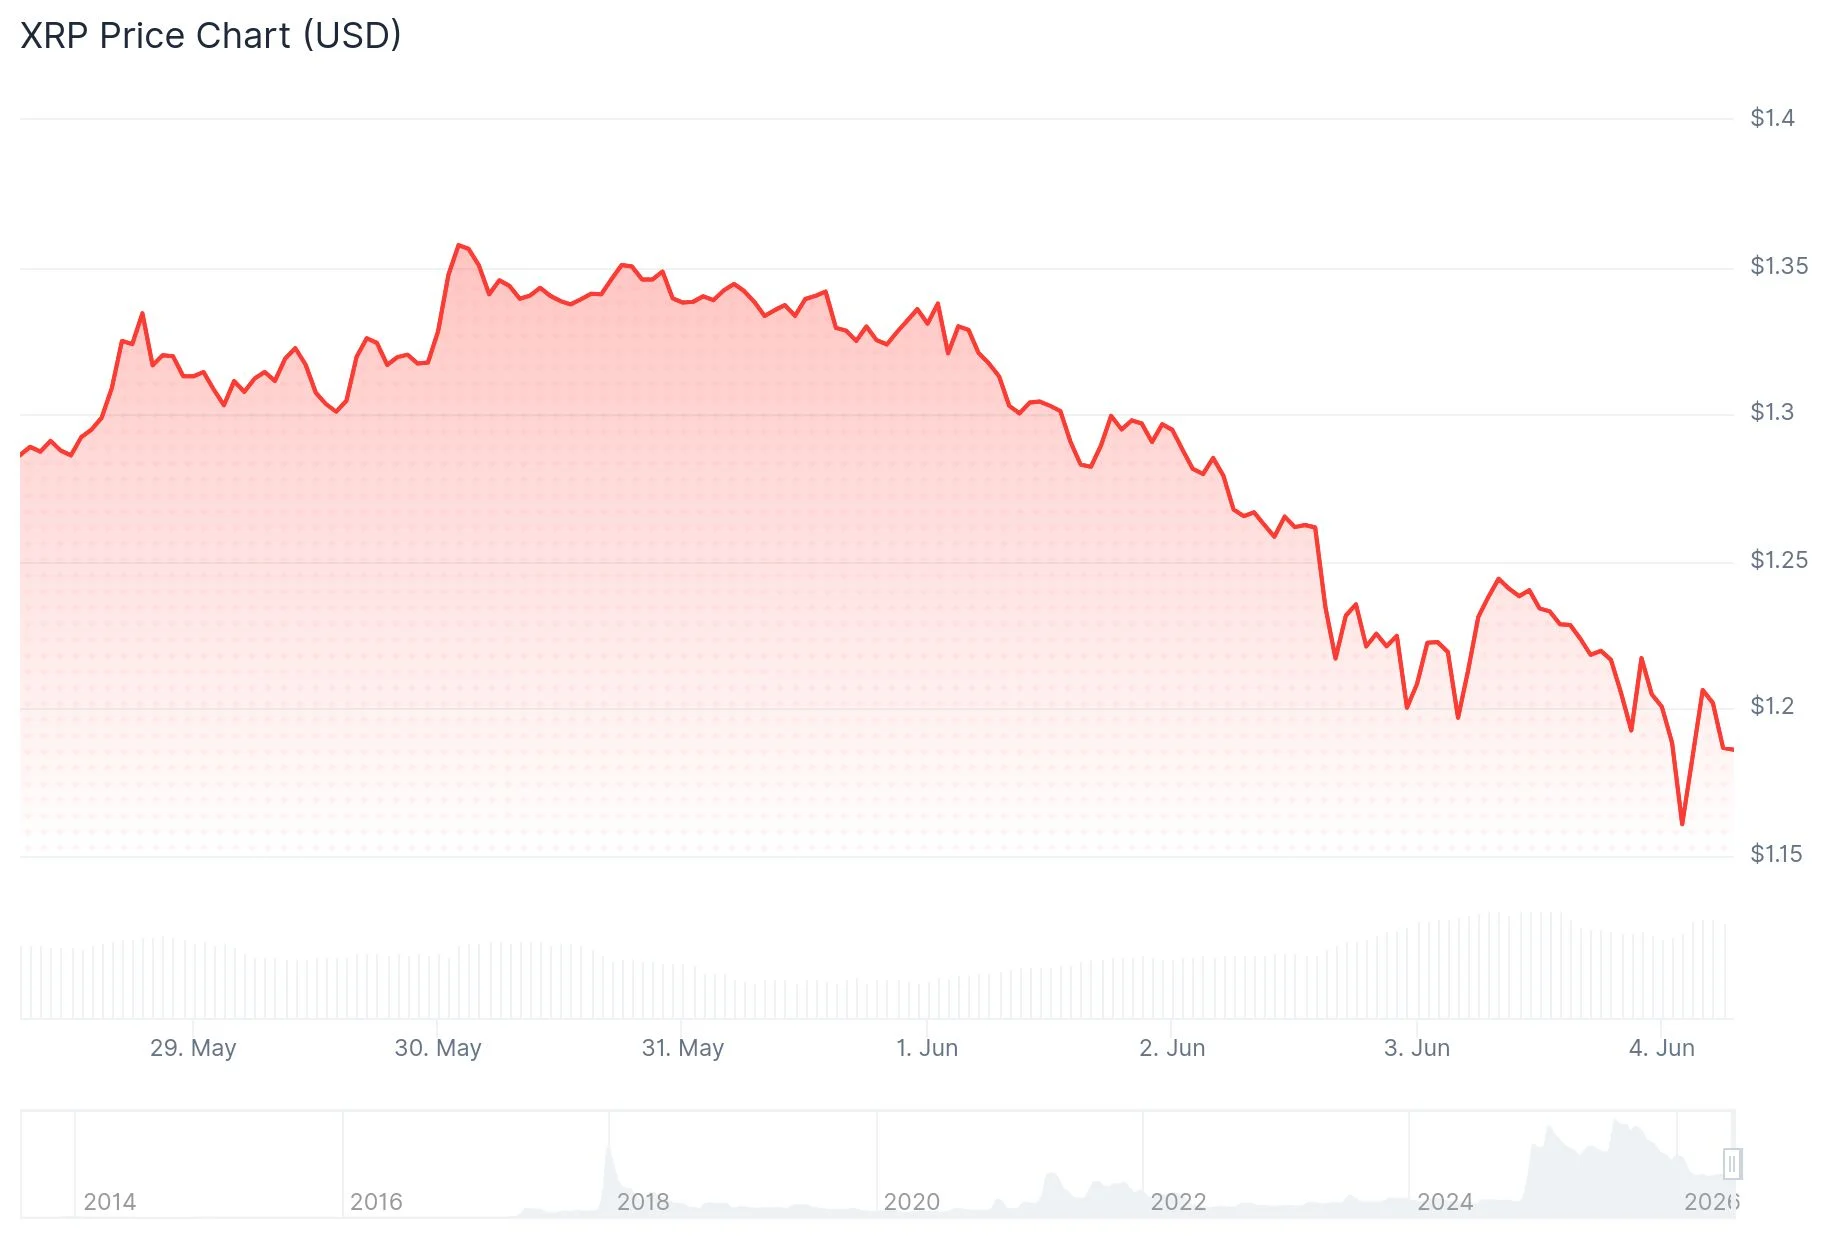
The digital asset breached the $1.20 support zone and continued its descent to reach a bottom at $1.1401. Currently, the token is moving sideways within a $1.15–$1.20 trading band, positioned beneath its 100-hour Simple Moving Average.
As of this writing, XRP is changing hands near $1.22, reflecting approximately 1% gains during the last 24-hour period.
Hourly chart analysis reveals a descending trend line establishing resistance around the $1.1950 mark. Additionally, the price has been unable to recover the 23.6% Fibonacci retracement level calculated from the downward swing between the $1.3640 peak and the $1.1401 bottom.
To initiate a meaningful reversal, XRP must successfully breach and maintain levels above $1.1950. Such a breakthrough could pave the way toward $1.20, followed by $1.22, and ultimately $1.25.

$1.32 Represents Critical Inflection Point for Recovery
The most significant resistance threshold for XRP supporters stands at $1.32. A convincing close beyond this barrier could trigger an upward movement toward $1.43, which would represent approximately 17% appreciation from present valuations.
Nevertheless, MACD momentum indicators continue displaying negative histogram readings, reinforcing the prevailing bearish sentiment. Without clear technical confirmation, both upside and downside scenarios remain viable possibilities.
XRP functions predominantly as a digital asset for international money transfers, while the XRP community has been debating what some refer to as an “XRP Supercycle” — a theory suggesting dramatic price appreciation ahead. Yet, market action has not validated this perspective thus far.
Technical analyst ChartNerd (@ChartNerdTA) issued a cautionary message on X, highlighting that XRP has fallen below the Upper Regression Band positioned at $1.35 on the Gaussian Channel. He emphasized that throughout XRP’s trading history, each instance of breaking below this band has resulted in a retreat to the Middle Regression Band, presently located at $0.84. According to his analysis, the 2026 “homecoming” to that price zone remains likely.
Critical Support Zones Under Observation
Looking at potential downside scenarios, the first support level appears near $1.16, with secondary support at $1.155. Should XRP fall below $1.155, traders should monitor $1.15 and $1.144 as subsequent support targets.
A breakdown beneath $1.144 would establish a pathway toward $1.14 and potentially deeper levels.
The Relative Strength Index currently indicates oversold conditions, which may draw opportunistic buyers seeking short-term positions. However, oversold readings alone cannot trigger trend reversals without corresponding price action and catalysts.
XRP’s most recent touch of $1.1401 during this pullback established the current local low point.
Get 3 Free Stock Ebooks
Discover top-performing stocks in AI, Crypto, and Technology with expert analysis.
- Top 10 AI Stocks - Leading AI companies
- Top 10 Crypto Stocks - Blockchain leaders
- Top 10 Tech Stocks - Tech giants


