
 Poised for $100 Rally as Key Resistance Zone Comes Into Focus")
Key Highlights
- SOL maintains support above its 50-day EMA at $87, with critical resistance forming between $90 and $94
- Crypto analyst Ali Martinez identified a narrow Bollinger Band compression zone ranging from $77 to $94 on the 3-day timeframe
- Solana ETFs attracted $9.44 million in weekly net inflows, extending a five-day streak totaling approximately $1.45 billion
- Goldman Sachs revealed holdings worth roughly $108 million in Solana
- Breaking decisively above $94 could trigger a rally toward $100, while failure to hold $77 may invite further downside
Solana (SOL) is currently exchanging hands around $87–$88 during Monday’s trading session, maintaining its position above the 50-day Exponential Moving Average (EMA) positioned at $87.04. Following a bounce from the recent trough near $84.55, the cryptocurrency is now challenging a pivotal resistance area.
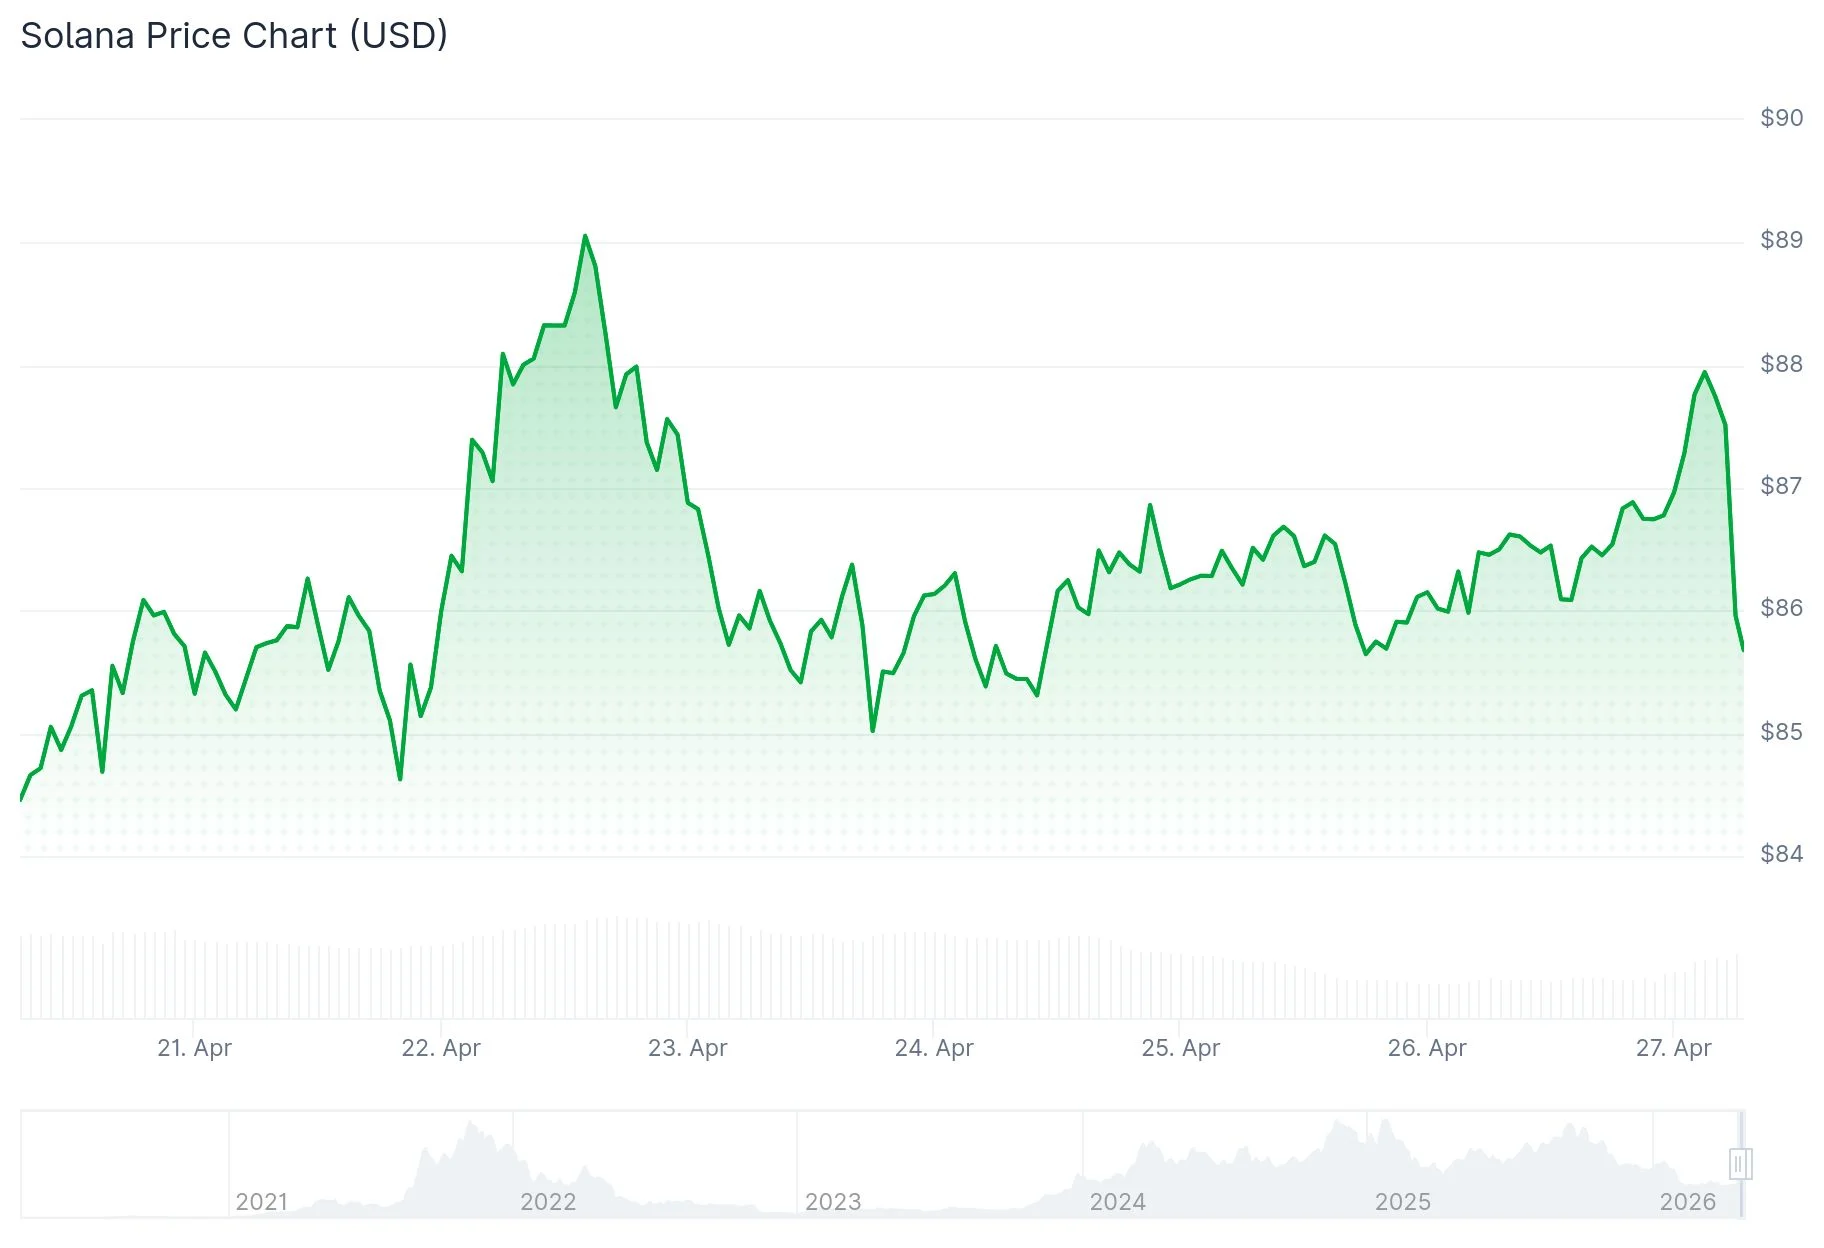
The digital asset has climbed past the 50% Fibonacci retracement mark derived from its recent decline between $89.34 and $84.55. Technical charts reveal an emerging bullish trendline providing support at the $86.50 level on the hourly timeframe.
The first resistance barrier appears at $88.20, corresponding with the 76.4% Fibonacci retracement. Beyond that, traders are monitoring the $90 level, with $92 representing the next significant hurdle.
Market analyst Ali Martinez pointed out that SOL is currently confined within a compressed Bollinger Band channel on the 3-day chart, spanning from $77 to $94. Martinez characterized this area as a “no-trade zone,” cautioning that attempting to trade within this range often results in unpredictable losses. According to Martinez, confirmation requires a definitive 3-day candle closure beyond these boundaries before considering any directional move legitimate.
Trading volume has contracted by over 23% throughout this consolidation period. While diminished volume during sideways price movement is typical, any breakout attempt above $94 would require substantial volume support to sustain momentum toward the $100 target.

Technical Signals Show Emerging Bullish Momentum
The Relative Strength Index (RSI) currently reads 55 on the daily chart, climbing above the neutral 50 level. Meanwhile, the MACD indicator along with its signal line has crossed into positive territory, indicating that buyers are gaining control.
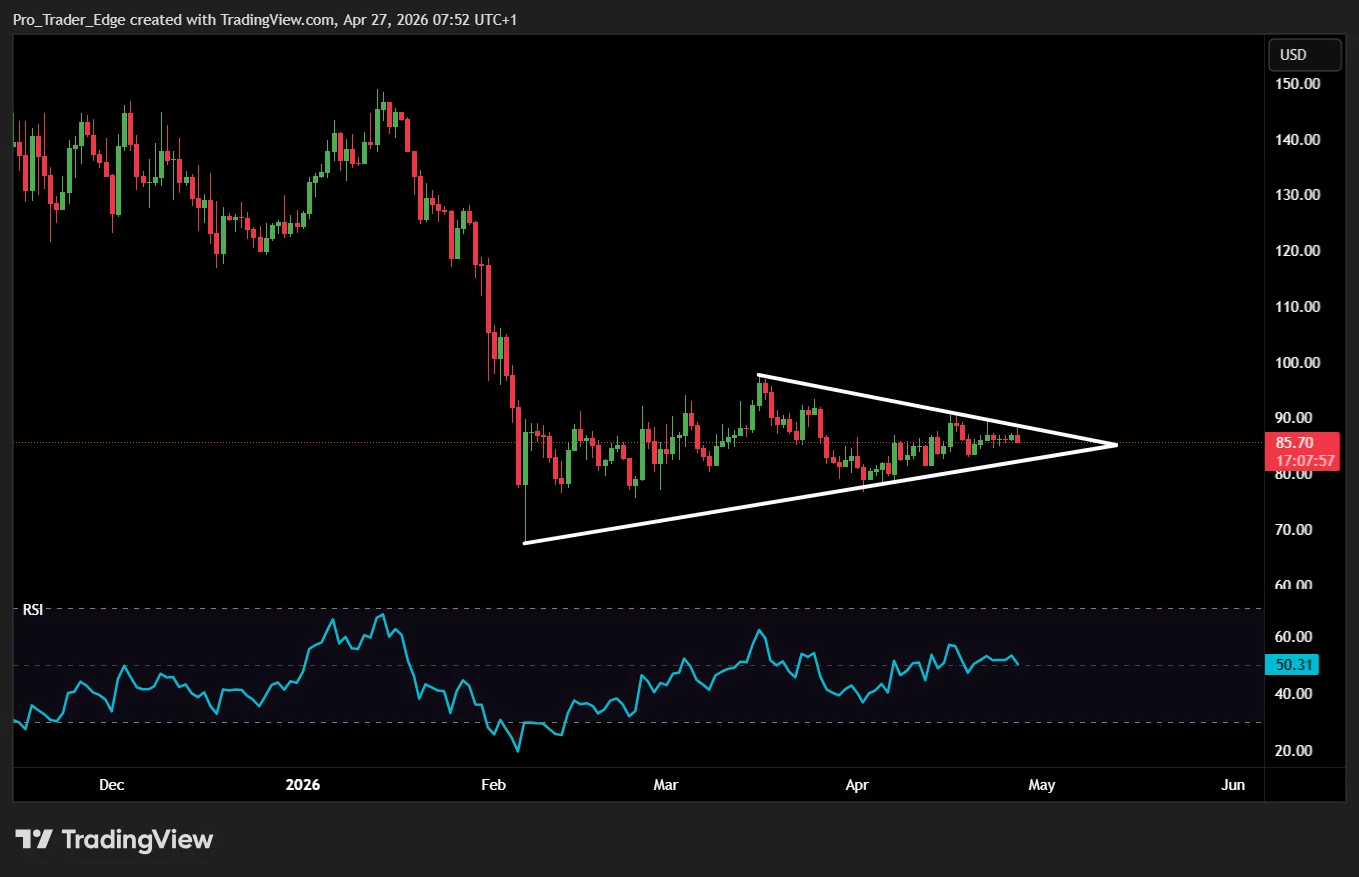
SOL is testing the upper boundary of a symmetrical triangle formation near $89.00 on the daily timeframe. Successfully clearing this resistance would bring the psychologically significant $100 level into play, followed by the 200-day EMA positioned at $113.
For downside scenarios, the 50-day EMA at $87.04 serves as the initial support layer. Should price close below the ascending trendline near $85.99 on a daily basis, the current bullish setup would be compromised.
Growing Institutional Participation and ETF Activity
Solana-focused exchange-traded funds captured $9.44 million in net inflows during the past week, following the previous week’s $35.17 million. A consecutive five-day streak of positive flows has accumulated roughly $1.45 billion.
Investment banking giant Goldman Sachs has disclosed exposure totaling nearly $108 million in Solana, representing another significant institutional endorsement that market participants are monitoring closely.
SOL futures Open Interest climbed more than 2% over the past 24 hours, reaching $5.23 billion. The funding rate jumped to 0.0095%, suggesting traders are willing to pay elevated premiums for maintaining long exposure.
Should SOL encounter rejection at the $90–$94 resistance cluster, the first support zone emerges at $86.50, followed by $85. A daily close beneath $78 could accelerate selling pressure toward the $72 region.
Get 3 Free Stock Ebooks
Discover top-performing stocks in AI, Crypto, and Technology with expert analysis.
- Top 10 AI Stocks - Leading AI companies
- Top 10 Crypto Stocks - Blockchain leaders
- Top 10 Tech Stocks - Tech giants


