
 Prepares for Massive Breakout as Weekly MACD Signals Major Rally Ahead")
Key Takeaways
- A bullish MACD crossover has appeared on Solana’s weekly timeframe, historically signaling rallies ranging from 100% to 860%
- Weekly RSI has climbed back to 35 after bottoming at 25 in February, mirroring conditions from the 2022 cycle low
- Daily chart reveals a symmetrical triangle formation with a potential upside target near $130
- Critical resistance zone between $90 and $96 contains approximately 9.9 million SOL tokens held at break-even prices
- Market analyst Ali Charts identifies a Bollinger Band compression on the 3-day timeframe, suggesting $77-$94 represents a consolidation range
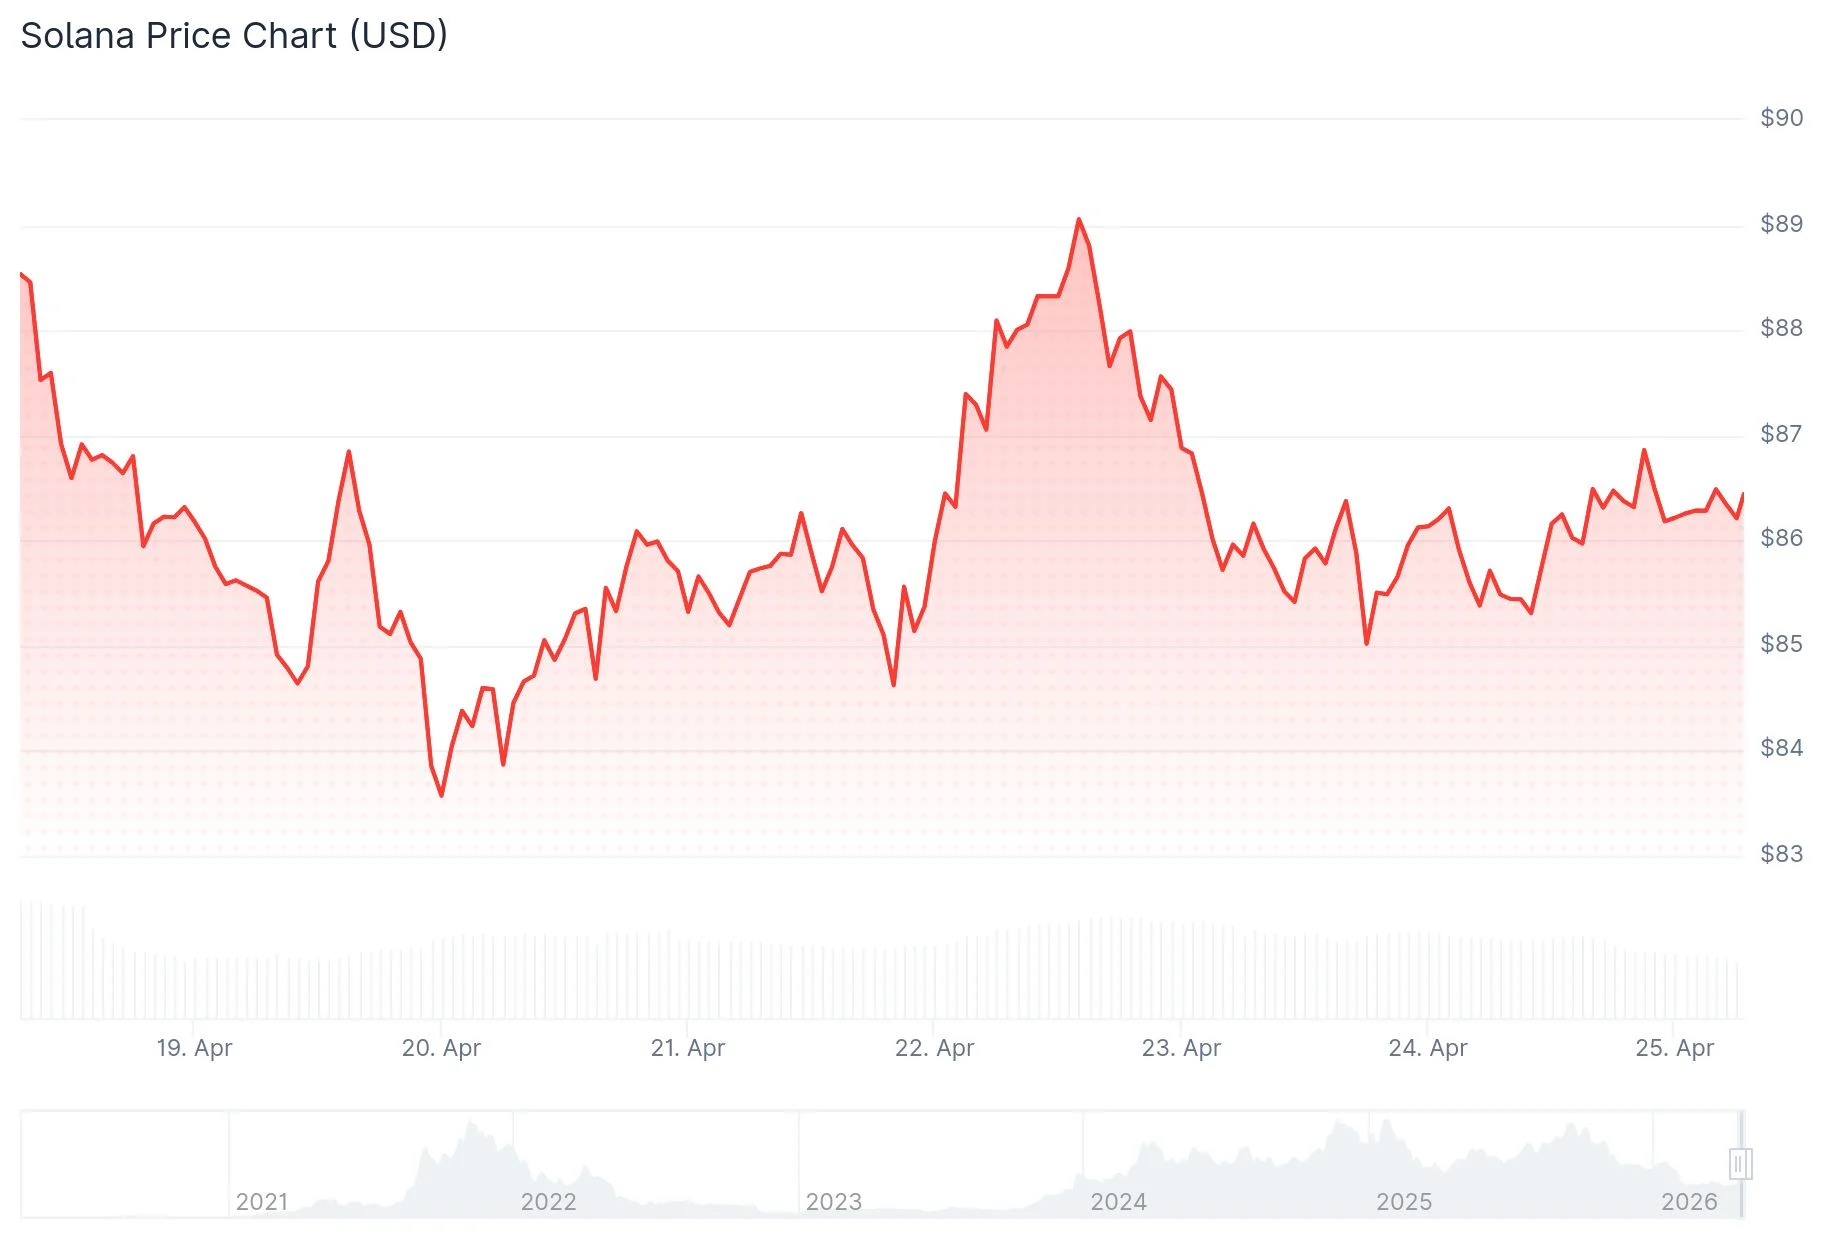
Solana (SOL) has triggered a significant bullish signal on its weekly chart through a MACD crossover—an indicator pattern that has historically marked the beginning of substantial upward movements. The cryptocurrency is currently consolidating around $85-$86 following a retreat from its recent weekly peak of $89.
On the weekly timeframe, the MACD line has pushed above its signal line, replicating a crossover pattern that emerged in May 2025. Following that previous occurrence, SOL surged from approximately $125 to surpass $250, representing nearly a 100% increase.
Historical data shows that comparable MACD signals preceded even more dramatic price movements: an 860% rally in 2023 and a 617% surge during 2021.
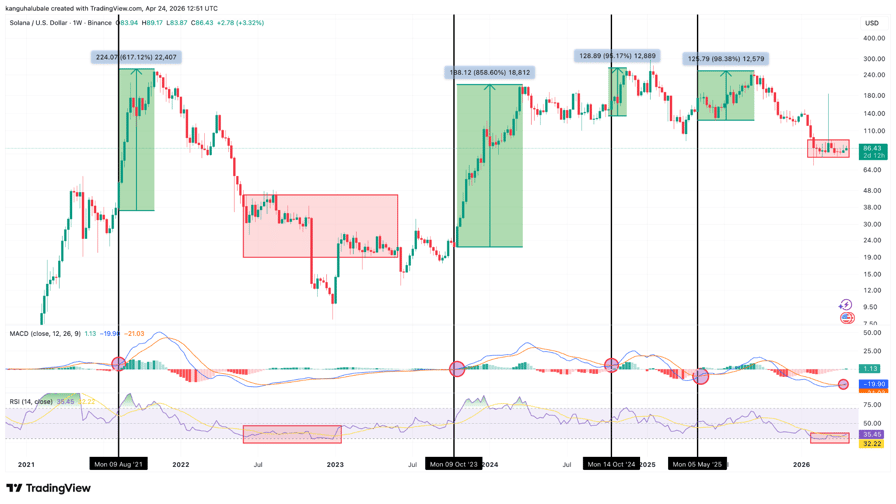
Additionally, the weekly RSI has recovered to 35 from its February low of 25. This current reading aligns with the RSI level recorded at Solana’s 2022 bear market floor, which subsequently sparked a massive 2,500% rally culminating at $210 by March 2024.
Market analyst Tyler Hill highlighted that Solana’s RSI had declined below 35 for the first time in over 1,200 days. He emphasized that the previous occurrence of such deeply oversold conditions marked the ultimate bear market bottom before a 3,000% price explosion.

Analyst Sixtysecondalpha characterized the recent MACD crossover as occurring after the indicator’s “lowest stretch ever.” When combined with bullish RSI divergence patterns, they projected that SOL is positioned for its “most powerful move” seen in the past two years.
Symmetrical Triangle Points to $130 Objective
On the daily timeframe, Solana has constructed a symmetrical triangle consolidation pattern. The breakout threshold is positioned at $90. Should the price achieve a confirmed close above this level, the pattern’s measured move projects an upside objective of approximately $130, representing roughly a 50% gain from current valuation.
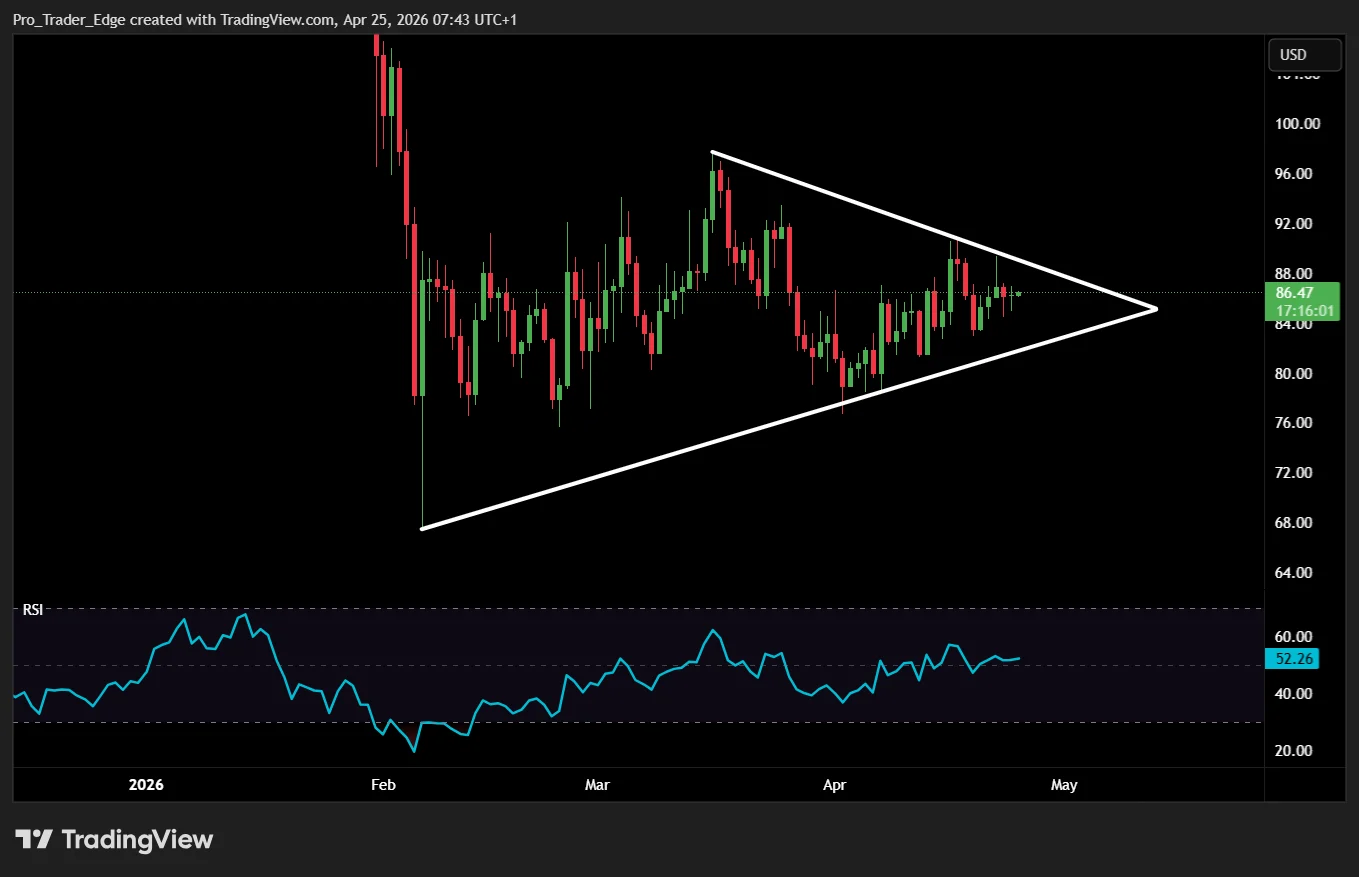
The daily RSI has rebounded to 52 after reaching an extremely oversold level of 11 on February 6, indicating strengthening bullish momentum.
Critical Resistance Zone at $90 Level
The $90-$96 price range represents a substantial technical obstacle. According to Glassnode on-chain data, approximately 9.9 million Solana tokens are currently held by investors with an average acquisition price between $90-$92. This concentration of break-even holders could trigger significant selling pressure as these market participants seek to exit positions without losses.
Adding to the technical confluence, the 100-day moving averages also intersect within this resistance zone, creating multiple layers of potential supply.
Analyst Ali Charts identified a Bollinger Band compression pattern developing on the 3-day chart, with price action confined between $77 and $94. Ali Charts described this range as a “no-trade zone” and recommended traders wait for a definitive 3-day candle close beyond these boundaries before establishing new positions.
Solana is currently maintaining support within the $85-$86 corridor as buyers continue efforts to push price action back above the critical $90 threshold.
Get 3 Free Stock Ebooks
Discover top-performing stocks in AI, Crypto, and Technology with expert analysis.
- Top 10 AI Stocks - Leading AI companies
- Top 10 Crypto Stocks - Blockchain leaders
- Top 10 Tech Stocks - Tech giants


